NZD/HKD Forecast
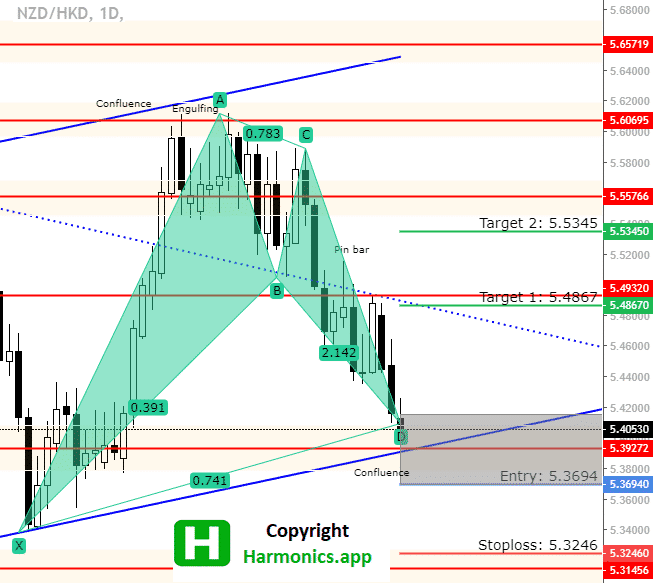
The NZD/HKD pair has formed a bullish Bat pattern which has several good trading signals pointing the price could move UP.
The pair is currently in the uptrend channel where we have higher lows and higher highs.
That is visible on the chart where trend lines are connecting those levels.
The price has broken below previous support at 5.49320 where we have a bearish Pin bar formed on the retrace.
The Pin bar formed as a confirmation that the previous support is acting as a resistance.

Facebook Community
Do not forget to join facebook community where you can see trading ideas, strategies and share your own trading ideas and strategy
The price is in the short term bearish mode and now is reaching support level where we could see price reverse.
From there the price moved down and now it is close to support at 5.39272.This is the support that will have an impact on the price like in the previous attempt in July this year.
Support at 5.39727 is a confluence of support where uptrend line and horizontal support represents support for the price.
We could see price reaching support level and then forming a bullish pattern which could indicate bullish reversal.
At this point it is good to wait until price reaches support and form a bullish price action signal in the Potential reversal zone marked with grey rectangle.
Stop loss is below previous lows you can see in the past, and it is close to next support at 5.31456.
That gives good insight where the price could not reach lower levels which could happen again.
First profit target is at 5.48670 which is close to the first resistance level. This makes the target reachable because the price in the past did not have any problems reaching it.
Second profit target is at 5.53450 which is below the second resistance level and if the price manages to break the first resistance then this level will not be hard to reach.
This trading signal has a 3,68 Risk to Reward ratio and it makes it a good trading opportunity.
Check other trading analysis inside – Bat Pattern Trading articles
Price Action Analysis
With this PDF you will have step by step guide how to analyse harmonic patterns detected by the Harmonics.app scanner
Price Action Analysis Details – For GOLD members
Join and read below all details about analysis on thih pair.

0 Comments