Potential Reversal Zone aka PRZ in harmonic trading is an area where the harmonic pattern completes and where the trading entry opportunity is. Trading opportunity is in reversal where the price tends to change the direction when it comes to the harmonic pattern D point.
Potential Reversal Zone Meaning
Potential reversal zone is a place where D point of a harmonic scanner ends and where you can place your entry for Sell Limit order or Buy Limit order because you will have a high probability of a price reversal.
As mentioned in each article about harmonic patterns on this blog, Fibonnaci ratios are used to define each point of the harmonic pattern.
So, D point as the last point has few Fibonnaci ratios that are pointing to that level so you have a high confluence of sellers in case of bearish harmonic pattern and a lot of buyers in case of bullish harmonic pattern.
In practice, have in mind to have at least minimum 2 Fibonacci price ratios in a close range. When a price enters the PRZ you can expect that this area will stop the prior market move and act as Support or Resistance.
Then you wait for some kind of confirmation to enter into the trade.
You will see a lot of people say that Potential reversal zones or PRZ have Fibonnaci ratio converging to D point. That means Fibonnaci ratios tend to point to a specific point. As they add, one by one, the point where they are pointing becomes more and more significant.
Then, you as a trader watch that point and it becomes more and more significant. As you look at that point as a potential reversal point so do all other traders look the same way.
And then when you sum all traders that think the same one thing happens.
What is that?
All traders open an order and do the same thing. They sell or buy the currency pair and the price moves in that direction. The price reverses on the potential reversal zone PRZ.
Real Trading Example
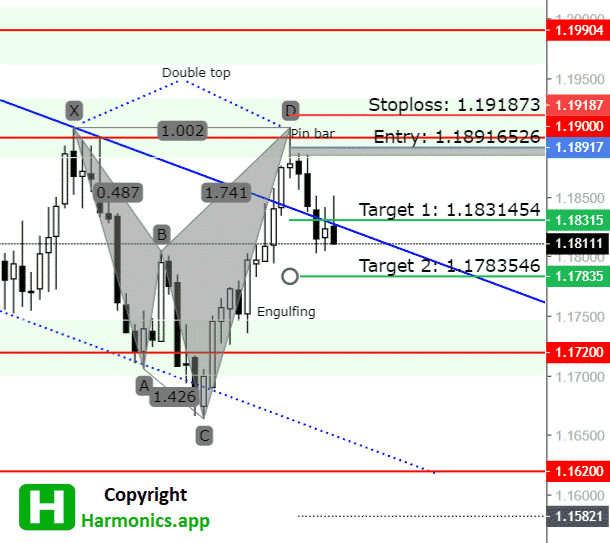
Here is real trading example with harmonic pattern where scanner is showing PRZ.
You can see the PRZ is marked as grey rectangle. It is an area where you can enter into the trade.
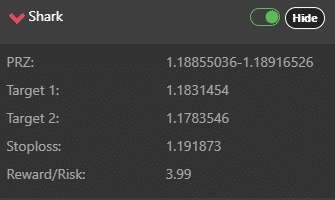
When you are inside scanner you have small window where you check what is the PRZ and there you see an area where you can enter.
How to Draw Harmonic PRZ
To give you an example of how to draw harmonic potential reversal zones, PRZ, I will use Gartley harmonic pattern.
When I use Gartley pattern the key Fibonacci ratios that are pointing or converging in the PRZ are:
- the 0.786 X-A leg
- 1.27 B-C leg, 1.618 B-C leg
- the level where A-B = C-D
Let’s take a look at PRZ on the image below.
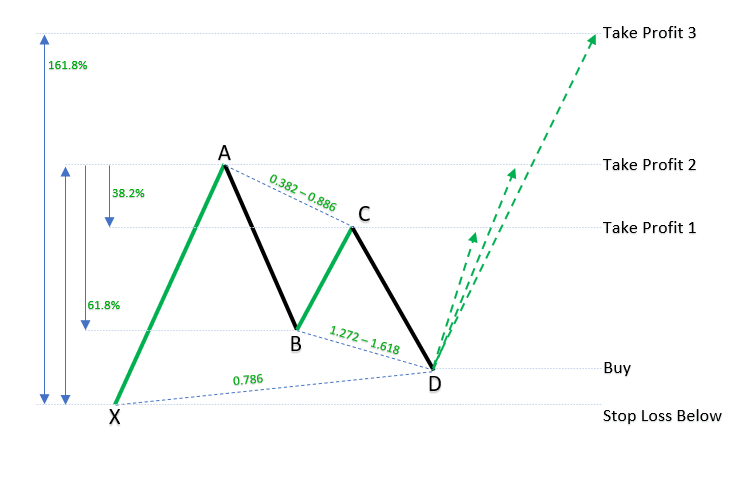
You can see that many Fibonnaci ratios are pointing or converging to the D point.
Potential reversal zone is the D point where All Fibonnaci ratios are coming to one place pointing where there is a high probability of reversal in the market.
When the price comes to the D point you can expect the price will have high volatility, spikes on the prices due to high volatility, price action movements and candlestick patterns.
Lets see how that looks in the real example.
I will use a harmonic scanner application to draw me a Gartley pattern which will show me entry and exit levels.
Potential Reversal Zone Example
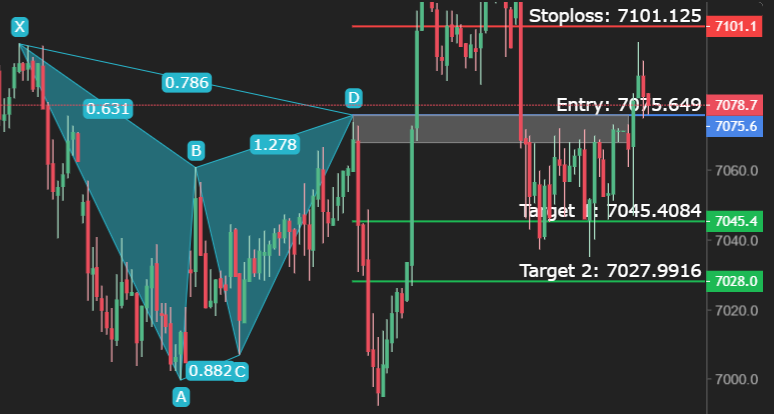
As you can see in the image below we have several Fibonnaci ratios coming to the D point.
Here they are:
- 0.786 retrace of X-A leg
- 1.278 extension of B-C leg
- A-B leg is almost equal length as C-D leg
Harmonic scanner has drawn automatically where the PRZ zone is and where the entry level is.
Entry area is drawn as grey rectangle around the D point.
If you want to trade this pattern you would set Sell Limit order at the start of the grey rectangle with stop loss above X point.
Profit target would be below B point and above C point.
As you can see the price has respected bearish Gartley pattern and if you trade this trading idea then you would make money.
Potential reversal zone was precise and you could make profit from this trade.
How is Potential Reversal Zone PRZ Calculated?
Potential reversal zone is calculated by Fibonnaci ratio that defines harmonic patterns.
When few Fibonnaci ratios converge or point to the same place, is that an area or a price level, it is potential reversal zone PRZ where the price will probably change the direction.
The PRZ zone is not easy to calculate by hand because it takes time and geometry to draw it successfully. You also need a good eye to spot harmonic patterns and then you need to define which harmonic pattern is.
When you define, spot the pattern, draw the pattern on the chart you will see where Fibonnaci ratios are pointing.
That point will be PRZ.
Calculation can be done automatically if you use a harmonic scanner or harmonic pattern indicator. I suggest you use this one below because it has a nice overview of harmonic patterns and you get notification when the pattern appears.
Now, let me show you how Fibonnaci ratios are used in a different way to get potential reversal zones.
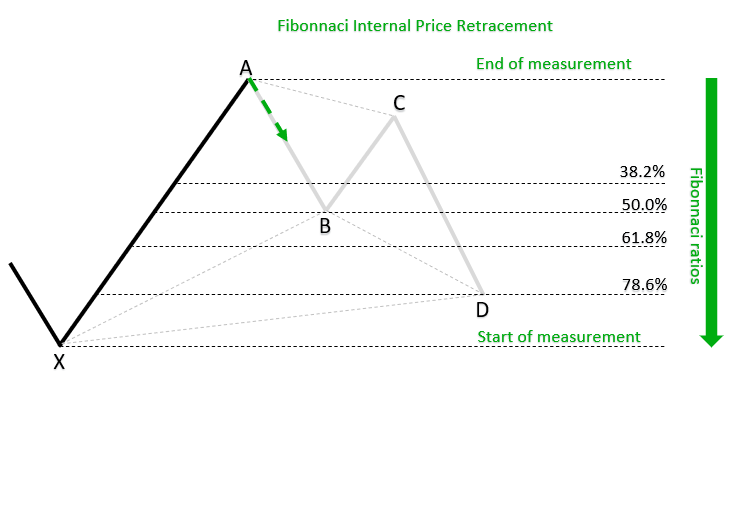
PRZ Internal Price Retracements
Internal price retracements are retracements of less than 100% of Fibonnaci ratios.
This can be seen as a correction to the prior trend.
Most common ratios for internal retracements:
- 38.2%
- 50%
- 61.8%
- 78.6%
PRZ External Price Retracements
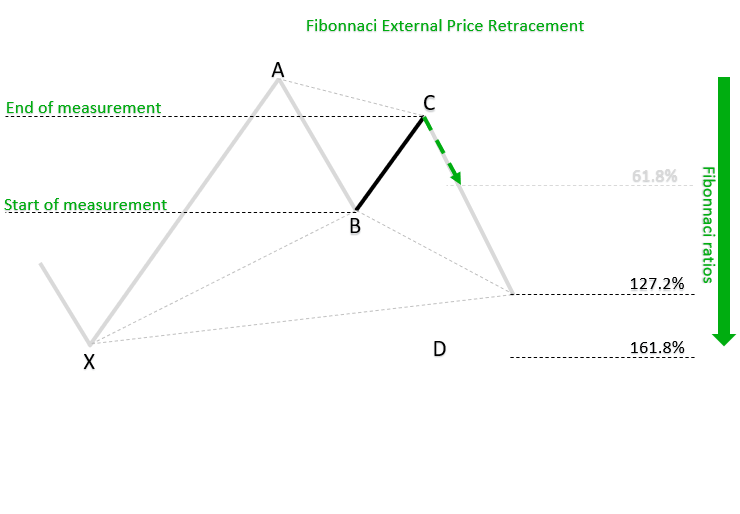
An external retracement is greater than 100% of the swing that is retraced. It can be seen as part of a new trend.
Most common ratios for external retracements:
- 127
- 161.8%
PRZ Price Expansion
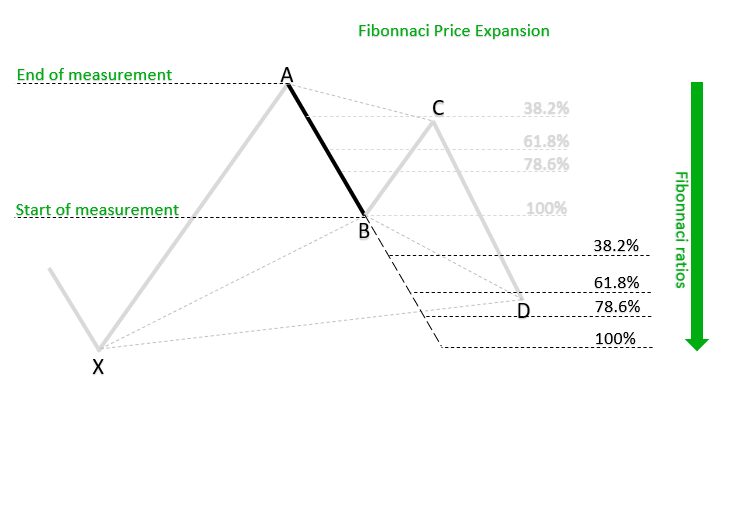
Price Expansions expand the price swing by a chosen ratio listed below.
Most common ratios for price extensions:
- 61.8%
- 100%
- 161.8%
- 200%
- 261.8%
PRZ Price Projections
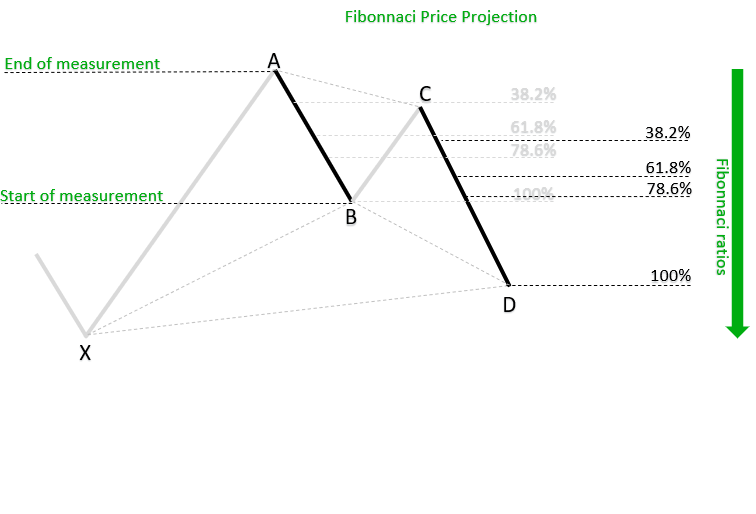
Price Projections are measurements which compare swings in the same direction. They project trend swings with trend swings and corrections with corrections.
We simply take low to high swing and project it from different points on the chart.
Most common ratios for projections:
- 61.8%
- 100%
- 161.8%
- 200%
Conclusion
By using a combination of retracements, projections and extensions we can have an area of Fibonacci ratios also known as Fibonacci confluence, convergence or Potential Reversal Zone.
If you combine more lines from different measurements like adding support and resistance level, you will have stronger PRZ.
With stronger PRZ it will mean higher probability to have a profitable trade.
Adding currency strength into account at the PRZ you can get more reliable signal. And if you trade strong currency against weak one then you increase chance of success.
Harmonic Patterns Cheat Sheet
All Harmonic Patterns on one place with important tips for trading.

0 Comments