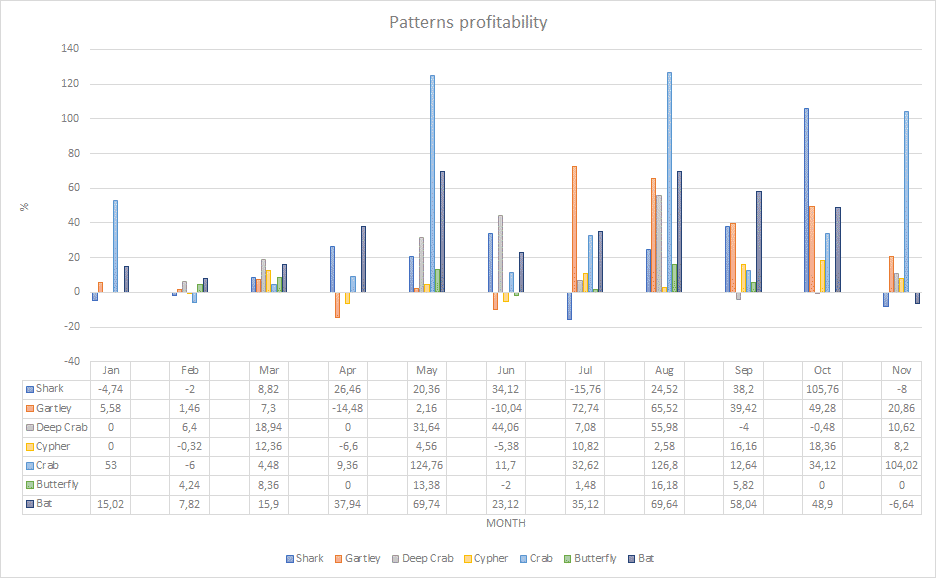
Harmonic Pattern Success Rate
Here you will find success rate of all harmonic patterns and other patterns that are analyzed on the Harmonics.app website with price action analysis using harmonic scanner.
Trading strategy consists of using:
- support and resistance lines
- trend lines
- channels
- chart patterns
- candlestick patterns
- harmonic scanner
The table below shows you:
- Symbol – it is symbol that is analyzed
- Pattern – which patterns is completed on the harmonic scanner
- Status – is the pattern successful or failed pattern
- R:R – risk to rewarad ratio
- Pips – number of pips gained or losed
- Date – when the pattern completed on the chart
The goal is to show you what you can make with harmonic scanner and patterns when they are picked and analyzed with price action analysis.
Note: where the field is empty without pip gained/lost that means the pattern still did not reach profit or stop loss target.
If you want to learn how to analyze the patterns and how to pick them among all patterns provided by the harmonics.app scanner then join below and you will receive instructions step by step.

Price Action Analysis
With this PDF you will have step by step guide how to analyse harmonic patterns detected by the Harmonics.app scanner

0 Comments