Harmonic Bat pattern is the second retracement pattern along with Gartley pattern. Bat pattern is considered as the most accurate harmonic pattern in Forex and it was defined by the Scott Carney.
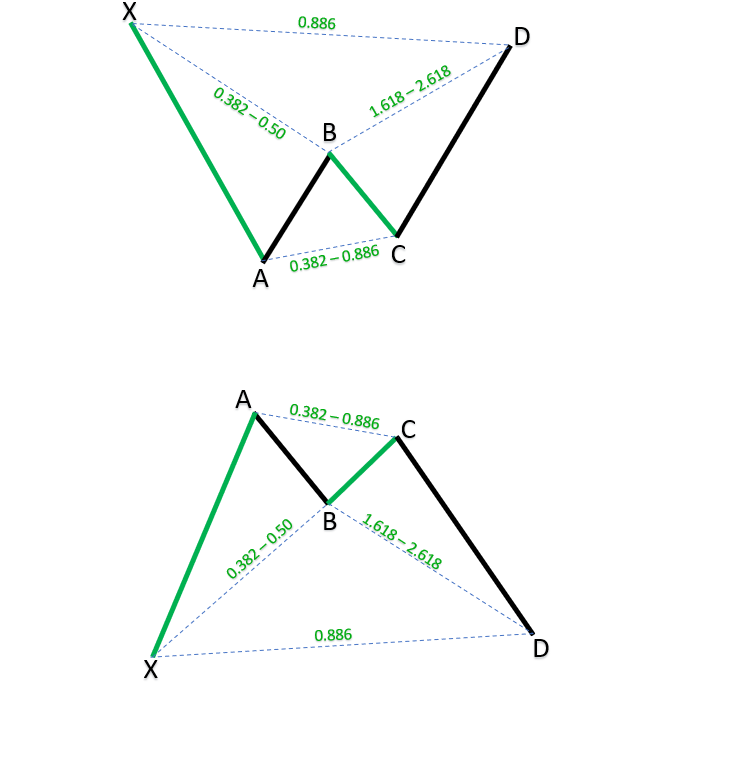
Image below shows you two Bat patterns, bearish and bullish bat patterns.
What you can see is that the D point is between X and A point like the Gartley pattern. D point is very close to X point which means the price will have large retracement.
Around D point it will be PRZ. When you draw potential reversal zone, you can prepare yourself for entering into the trade.
Bat pattern rules are explained below the image.

Harmonic Bat Pattern Analysis 8.11.2025
Do not forget to join facebook community where you can see trading ideas, strategies and share...
Harmonic Bat Pattern Analysis 1.11.2025
Do not forget to join facebook community where you can see trading ideas, strategies and share...
Harmonic Bat Pattern Analysis 18.10.2025
Do not forget to join facebook community where you can see trading ideas, strategies and share...
Bat Pattern Rules
Following are the Bat pattern rules you need to watch out. If they are not respected Bat pattern will be invalid and you should avoid trading it.
Key metrics to look out for are:
- A 0.886 XA leg has a retracement to the D point is necessary. The D point cannot exceed the X point – if it does, then the pattern is invalid
- Other Fibonacci levels should be closely grouped in the PRZ
- An extended AB = CD where the CD leg is 1.27 of the AB leg. Although, an AB = CD where AB and CD are the same length is acceptable, but is a minimum for the pattern to be valid
- Minimum 1.618 BC extension to the PRZ. It’s preferable if the BC extension is 2.0. Could also be as much as 2.618
- The B point retracement must be less than 0.618 to be a valid pattern. For example, B could be 0.5 or 0.382 retracement of the XA
Which time frame to use depends on you and your trading strategy. I would not trade time frames smaller than one hour H1, because higher time frames will give you better results.
Even higher time frames are slower and it sometimes takes days to form a harmonic pattern, when they give you correct trading signals then you will have high returns.
Four hour H4 and daily D1 time frame are the best you can use. If you have patience to wait for the signal then go for it.
Which currency pair to use in trading harmonic Bat patterns depends on you. For example, I like to trade EURUSD pair because it is not too fast and too slow and gives me good accurate patterns.
How Do You Make a Bat Pattern?
If you take a look at the image you can see that the first point is X point. Then the second point is A point. You will have five points like in the XABCD pattern which is the base for the Bat pattern.
To make a Bat pattern when you put the chart in front of you, your job is to find X-A leg because that is the starting point. Like with Gartley pattern you need to find a trend with the channel.
Then you need to find swing X-A which is close to channel support or resistance line. Because you need to find the best opportunity and that is using support and resistance levels.
Support and resistance levels gives you a place where the price could stop and reverse.
When you have X-A leg close to support/resistance level then you need to wait B point to form. B point cannot be larger than 0.382 or 0.50 retracement of X-A leg.
When it is formed in the A-B leg you can wait for the C and D leg.
You have all bat pattern rules you can follow in this article.
When the bat pattern is formed, by looking at the chart and drawing a bat pattern yourself or using a harmonic scanner who detects harmonic patterns, you can process with entering trading levels, entry price, stop loss and take profit.
Bearish Bat Pattern
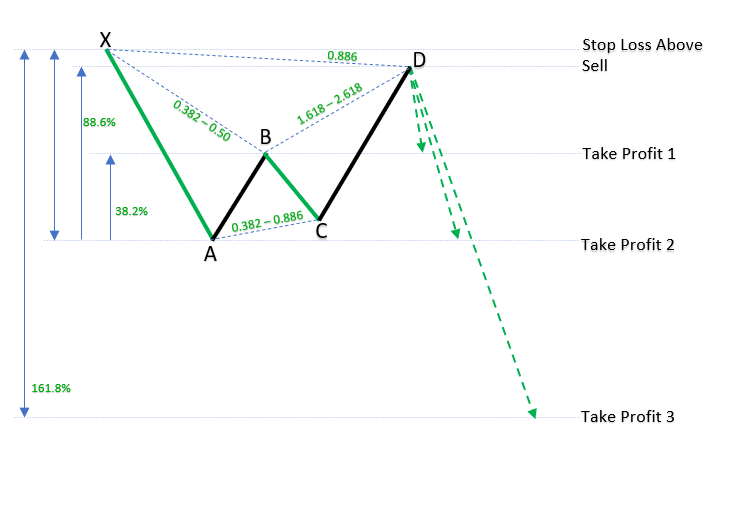
Image below shows you all the details you need to know how the bearish Bat pattern is formed.
The Bearish Bat pattern has a bearish X-A leg where the price moves from X point to A point.
Then the price reverses from A point to B point for 38.2% or max 50.0% of the X-A leg.
Final D point is around 88.6% of X-A leg, and it is between X-A leg. It cannot exceed above X point. If it does go above X leg then it is not a valid bearish Bat pattern.
Entry points with exit level are shown on the image.
Use risk management rules in trading and put stop loss above X point and minimize risk per each trade. Stop Loss can be put a little above X point just to avoid spikes which could trigger stop loss and then reverse back down without you.

How Do You Trade a Bat Pattern?
What you can see on the chart below is that bearish Bat pattern has formed. I have used harmonic scanner app to draw this pattern for me with entry levels.
You can see I have X-A leg and other points are drawn by the bat pattern rules I have listed above in this article.
When the price reaches the D point I have PRZ zone where I can enter into the trade with Stop Loss above X point.
If the price goes above X point then this Bat pattern is not valid and I can rule him out from trading. I need to wait for the next opportunity.
You see that the Bat pattern has formed in the descending channel. The market is moving down for a while. That means I am not entering into the trade right at the start of a channel, which increases my chance of success.
Another thing you can see is that D point is close to resistance level which is marked as grey line. That increases the chances the price will turn down because of sellers waiting on the resistance level.
Potential take profit levels are on the B point and C point as a start take profit points. Later on A point can be the final destination, but to verify that I need to wait what the market will do because it can reverse back up and I will exit with profits I make until then.

Bullish Bat Pattern
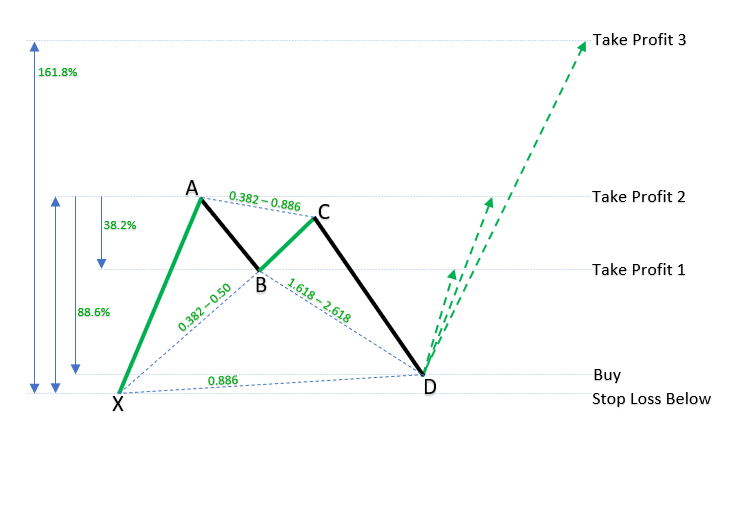
Image below shows you all the details you need to know how the bullish Bat pattern is formed.
The Bullish Bat pattern has a bullish X-A leg where the price moves from X point to A point.
Then the price reverses from A point to B point for 38.2% or max 50.0% of the X-A leg.
Final D point, which is the bearish leg C-D, is around 88.6% of X-A leg, and it is between X-A leg. It cannot exceed above X point. If it does go above X leg then it is not a valid bullish Bat pattern.
Entry points with exit level are shown on the image.
Use risk management rules in trading and put stop loss above X point and minimize risk per each trade. Stop Loss can be put a little above X point just to avoid spikes which could trigger stop loss and then reverse back down without you.

trade bat pattern

Conclusion
Bat pattern as the second retracement harmonic pattern is one of the most accurate harmonic patterns. It has tight stop loss which gives you a good risk to reward ratio.
Practicing how to draw Bat pattern or using a harmonic scanner can increase the success rate and be a profitable trader. Reading harmonic trading books can also help in understanding how the harmonic Bat pattern works.
Use bearish or bullish Bat pattern only in uptrend or downtrend channel with support and resistance lines which will increase success rate.
Using other indicators like price action pattern, Pin bar or engulfing bar, will increase success rate even more.
If you want to have trading tips for harmonic patterns you can get it on the link below.
Harmonic Patterns Cheat Sheet
All Harmonic Patterns on one place with important tips for trading.


0 Comments