The Harmonic Bat pattern is the first extension pattern along with Crab pattern. Extension pattern means the last D point is extending above X point.
Butterfly is a harmonic reversal pattern which shows a reversal point where the price will change its direction.
Harmonic Bat Pattern Analysis 27.7.2024
Do not forget to join facebook community where you can see trading ideas, strategies and share...
Harmonic Bat Pattern Analysis 20.7.2024
Do not forget to join facebook community where you can see trading ideas, strategies and share...
Harmonic Bat Pattern Analysis 13.7.2024
Do not forget to join facebook community where you can see trading ideas, strategies and share...
Butterfly In Forex
Harmonic Butterfly pattern in Forex is used to determine where the price of a currency pair will change its direction. When the trend comes to an end there will be Butterfly point D suggesting reversal price level.
D point like in other harmonic patterns in Forex is the point where the price consolidates which means stalls and prepares for the next move. That move can be in the same direction as it was moving earlier or it will change direction in the opposite way.
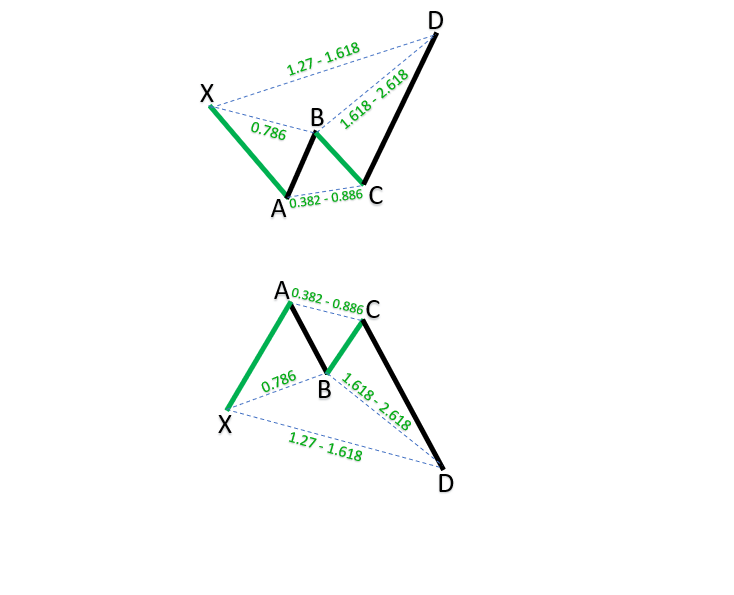
If you take a look into the image above you can see that Butterfly appears as a W or M letter. Depending on the market overview it can be bullish or bearish and it based of XABCD pattern.
You can see that the high of A point and C point are close to each other so you can think of it as a double top. If that happens watch out that the C point is below A point in case of bullish Butterfly. In case of bearish Butterfly, low of C point should be above A point.
Butterfly patterns in Forex will be valid if the legs you see in the image follow Fibonnaci ratios. In harmonic trading Fibonnaci ratios are important because harmonic patterns are defined by them.
Butterfly Pattern Rules
Here are the rules Butterfly pattern must comply to to be valid:
- Leg X-A is the first impulse swing
- A-B leg is a retracement of X-A leg with 78.6%
- B-C leg is 38.2% or 88.6% retracement of A-B leg
- C-D leg is 161.8% extension of B-C leg
- A-D leg is 127.0% or 161.8% extension of X-A leg
B point is one of the critical ones where it must be 78.6% retracement of X-A leg. Otherwise the Butterfly pattern is not valid.
What is a Bullish Butterfly?
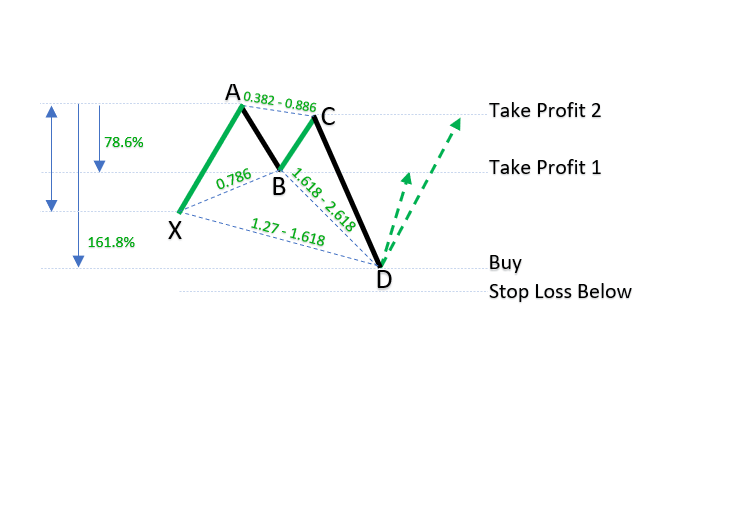
When the market is in downtrend you can expect a bullish Butterfly pattern on the end of that trend. If that happens you will have a pattern like in the image below.
D point that will form on the end of a trend will be a place where the price will likely reverse.
When you see a pattern in M shape be prepared to enter into the trade with Stop loss below D point.
Have in mind to use support and resistance levels around D point to have better entry price.
If you add candlestick patterns in your trading analysis you will increase accuracy of a pattern.
What is a Bearish Butterfly?
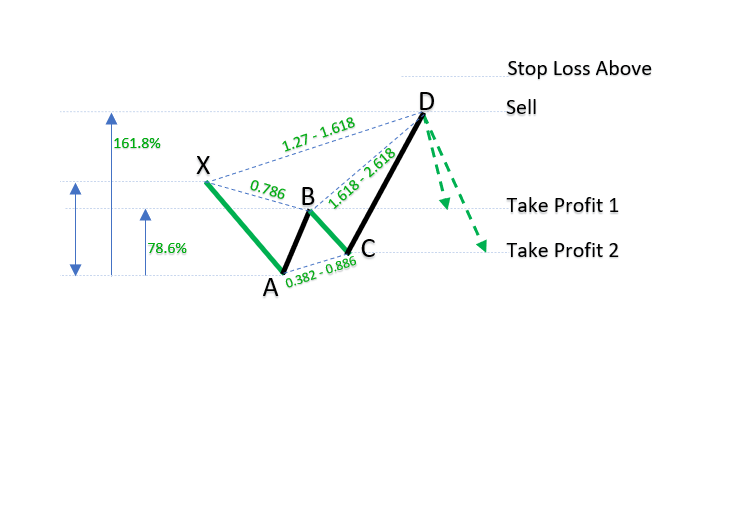
In an uptrend look for W shape close to support and resistance levels and you will have a bearish Butterfly pattern.
D point will be a reversal point where you can enter into the trade and expect the price to move down.
Image below shows you a bearish Butterfly pattern that forms in the uptrend and which has a D point as a potential reversal zone.
Stop loss would be above D point, but leave some space in case spikes happen on the market. That way you will avoid price spikes that can close your trade and then move in the direction you were expecting at the start.
Butterfly Pattern Trading
You as a trader can use Butterfly patterns to determine when the trend is coming to an end. D point that is extending will show you where the level is where the reversal will happen.
That point or level can be a new starting point of a new trend. If you catch new trends then you can make a lot of pips.
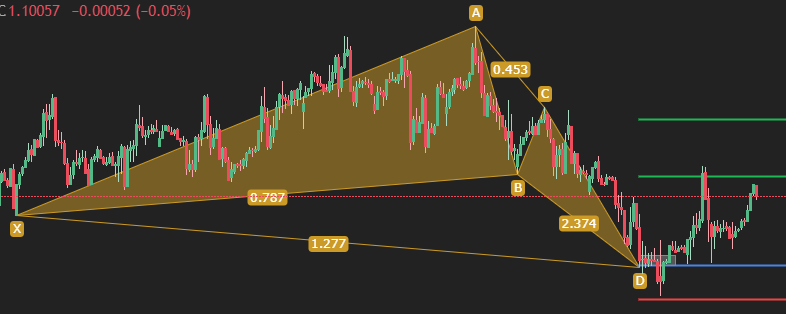
Image above shows an example of a Butterfly pattern detected by the harmonic scanner.
It shows you all the points, X,A, B, C, D and you can see the Fibonnaci ratio for each leg.
D point is the point where I can enter into the trade.
Stop loss is below and you can see the price has gone a little below D point. That is why I said earlier to leave some space for Stop Loss to avoid being kicked out from the market right at the start.
You need to count volatility and pip range for each pair to have a better picture of how much you can expect the price will move around D point.
The price then reversed up like bullish Butterfly defines the market movement.
The first profit target has been reached and that is on the B point.
Harmonic Patterns Cheat Sheet
All Harmonic Patterns on one place with important tips for trading.
Conclusion
Here are key takeaways for you to remember what is important about Butterfly pattern:
- The Butterfly formation is an extension pattern that is a part of the Harmonic patterns.
- The Butterfly pattern is a reversal pattern, which can often be found at the end of a trend
- Butterfly formation consists of five points: X, A, B, C, and D
- The pattern is represented by four important price legs : X-A, A-B, B-C, and C-D
- You have bullish and bearish Butterfly pattern
If you want to use a harmonic scanner which will draw harmonic patterns automatically for you and send you notification then check the scanner on the link below.


0 Comments