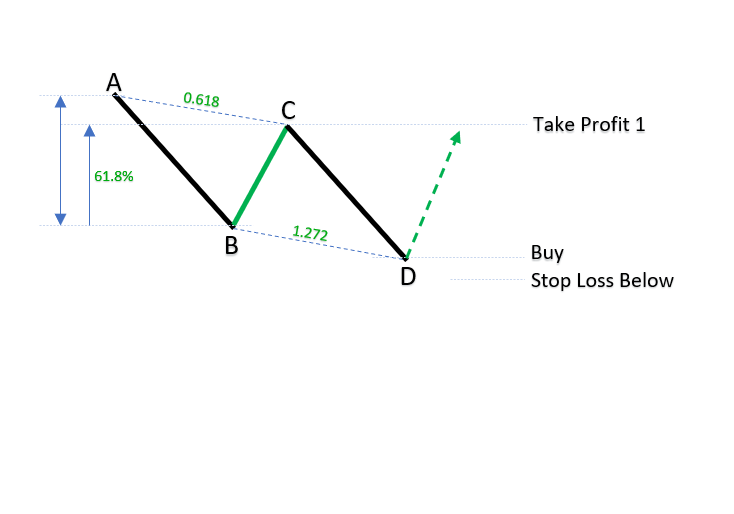
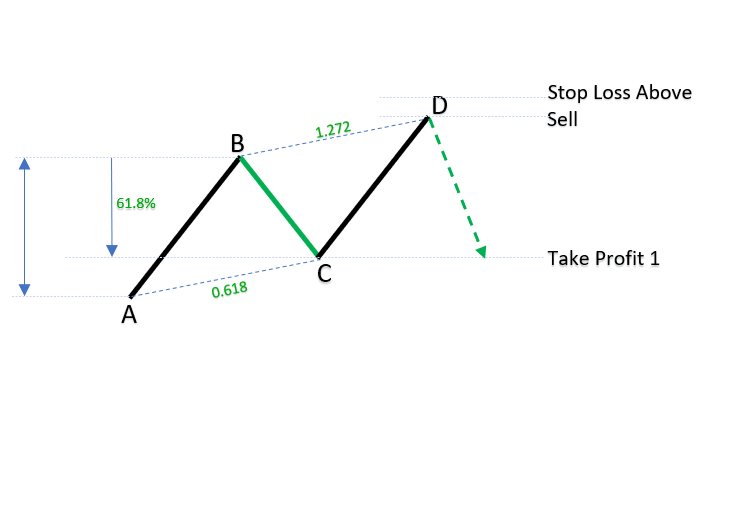
ABCD harmonic pattern in Forexis a reversal pattern which can be bullish or bearish and follows Fibonnaci ratios:
- B-C leg is 61.8% retracement of A-B leg
- C-D leg is the 127.2% extension of B-C leg
The ABCD pattern tells you when you can expect the market will reverse.
Harmonic Bat Pattern Analysis 28.6.2025
Do not forget to join facebook community where you can see trading ideas, strategies and share...
Harmonic Bat Pattern Analysis 7.6.2025
Do not forget to join facebook community where you can see trading ideas, strategies and share...
Harmonic Bat Pattern Analysis 31.5.2025
Do not forget to join facebook community where you can see trading ideas, strategies and share...
What is an ABCD pattern?
The ABCD pattern was created by Larry Pesavento and Scott Carney, but first it was discovered by H.M Gartley who invented Gartley harmonic pattern.
ABCD pattern is the most simple harmonic pattern among all other patterns because it has only two legs, A-B and C-D. It is also a base for other harmonic patterns because other harmonic patterns use ABCD move to determine other legs in their setups.
Same as 121 pattern it uses A-B=C-D leg rule which clearly have defind a rule that will help in determining the entry level. It is similar to three drives pattern which has symmetrical legs and 0.618 retracement leg.

How Do You Find the ABCD Pattern?
First step is to find A, B, C and D points on the chart and that is by looking where the swing moves are on the chart. You find swings by looking where the market is making a large move and then reverse back and then make again a new swing and again reverse.
That is a 4 move setup which will make ABCD pattern on the chart.
Now, those swings can be made at any time on the market so you need to train your eye to easily spot ABCD patterns or you can use a harmonic scanner to detect the pattern.
As a first step, use the first swing which will make A-B leg. When you have the first leg then you need to wait until the market reverses back from the B point towards A point.
If the market reverses back 61.8% from B point to A point then you have B-C leg.
From this point you wait for the market to make another move in the direction like A-B leg.
If the price goes beyond B point then you need to prepare a Fibonnaci ratio 127.2% extension of B-C leg.
When the market reaches that extension you need to wait for the signal to appear near that point. The signal can be some sort of price action signal like candlestick pattern, Engulfing bar or Pin bar.
With a price action signal if you have support and resistance on that point then you are good to go and prepare to enter into the trade.
Support and resistance level increase the potential market reversal which ABCD harmonic pattern is used for.
ABCD harmonic patterns can show in two different types and those are bullish and bearish types.
Bullish ABCD Harmonic Pattern
Bullish ABCD harmonic pattern appears on the market when the price is moving down and then you expect the market will reverse.
ABCD pattern will show you when the market will reverse by making D point on the chart. D point will be below all other three points of ABCD pattern.
Take a look in the chart where you see all four points draw one after another downwards.
A point is the start point and then B point as the end of the first swing.
Then you have C point which is a retrace of the A-B leg by specific Fibonnaci ratio and that is 61.8%. This means the price returns from B point to A point for 61.8% of A-B leg.
Then, the price continues the same direction as the A-B leg and reaches D point which is below B point.
The C-D leg is the same length as the A-B leg, but the D point must come to an extension of 127.2% of the B-C leg.
When the price comes to the D point you can expect the price to reverse and change direction. You can expect the price to move UP where you need to enter into buy order.

Bearish ABCD Harmonic Pattern
Bearish ABCD harmonic patterns appear on the market when the price is moving up and then you expect the market will reverse.
ABCD pattern will show you when the market will reverse by making D point on the chart. D point will be above all other three points of ABCD pattern.
Take a look in the chart where you see all four points draw one after another downwards.
A point is the start point and then B point as the end of the first swing.
Then you have C point which is a retrace of the A-B leg by specific Fibonnaci ratio and that is 61.8%. This means the price returns from B point to A point for 61.8% of A-B leg.
Then, the price continues the same direction as the A-B leg and reaches D point which is below B point.
The C-D leg is the same length as the A-B leg, but the D point must come to an extension of 127.2% of the B-C leg.
When the price comes to the D point you can expect the price to reverse and change direction. You can expect the price to move DOWN where you need to enter into sell order.

Conclusion
ABCD harmonic pattern is the simplest one of all harmonic patterns because it has only two Fibonnaci ratios you must follow.
Pattern appears in a bullish and bearish form and gives reversal opportunities for a trader.
To spot ABCD patterns on the chart is not so hard, but with training you can learn what to watch first to note ABCD patterns quickly.
To trade the pattern takes time and see what works and what does not. Use support and resistance levels to increase the accuracy of the pattern.
If you want easier solution you can use harmonic scanner app which will help you in detecting harmonic patterns.
Harmonic Patterns Cheat Sheet
All Harmonic Patterns on one place with important tips for trading.


0 Comments