USDMXN Harmonic Pattern Forecast
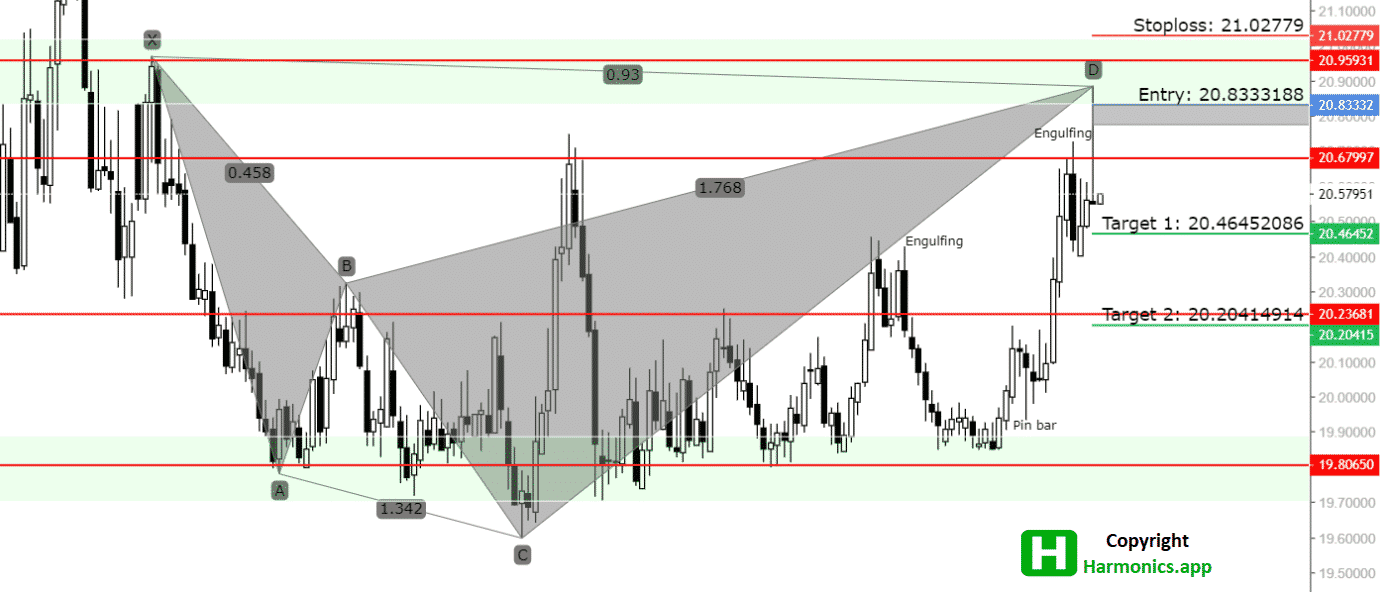
Daily Shark pattern shows us that there is potential reversal zone around 20.80 level.
We can see that the potential reversal level is close to the strong resistance level which had a strong impact on the price in the past.
Currently the price is below 20.67 level which is a small resistance level the price needs to break in order to reach stronger resistance.

The price action of the pair shows a bearish engulfing candle right on the small resistance level. And we can see the price did not close above the bearish engulfing candle on a daily basis.
This means the price could find a short lasting break above reaching 20.80 or 20.90 level and then reverse back down.
The price made one short lasting break above, but the price is now preparing for the next attempt which is visible with bullish candles in the last few days.
Shark pattern levels are shown by the harmonic scanner and stop loss level is just above previous highs and above strong resistance level.
Exit level is just in the middle between resistance and support line so it makes it easily reachable. Second exit target is close to the support level so I would pay attention to exit earlier around 20.30 level.
As the market looks like we could see sellers activated on the 20.80 – 20.90 level. Bulls have lost their strength so I am paying attention to selling opportunities.
Check other trading analysis inside – Shark Pattern Trading articles
If you want entry and profit target levels, register with powerful harmonic scanner.
Get notification on the telegram when trading idea appears so you do not miss trading opportunity.

0 Comments