How to use a harmonic scanner is pretty easy, but it depends on the type of harmonic scanner you use. If you want you can buy harmonic scanner here at Harmonics.app.
Use harmonic scanner with a web browser by logging into the scanner and then use harmonic patterns for trading with potential reversal zone marked as a D point.
You can use web based harmonic scanner, MT4 or MT5 indicator, cTrader harmonic scanner or some other scanner type.
In this article I will show you how to use harmonic pattern scanner app which is web based. That means you access the harmonic scanner over your browser over PC or mobile phone.
Harmonic Scanner Login
First you need to get on the harmonic scanner login page and enter your login details. If you did not register as a user then you need to register first.
I have to tell you that this scanner is a paid harmonic scanner. You need to pay a monthly fee, but it is the cheapest fee you will see on the market.
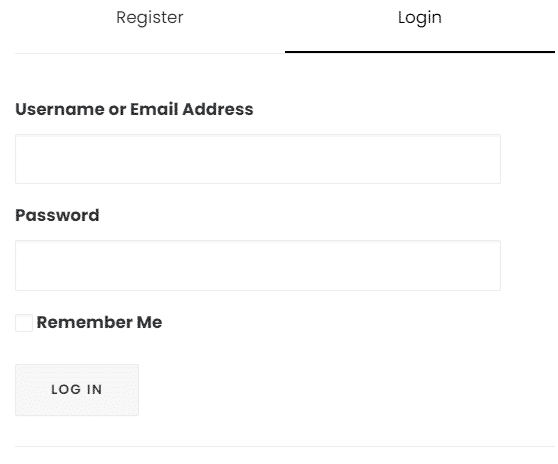
Enter your login details, username or email address and password.
When you enter them select the Login button and you will have a new window in front of you.
Harmonic Pattern Scanner Dashboard
To use a harmonic scanner in a proper way you need to know how to get around. As a first step when you login into the scanner you will see the chart in front of you.
You will have several menus in front of you:
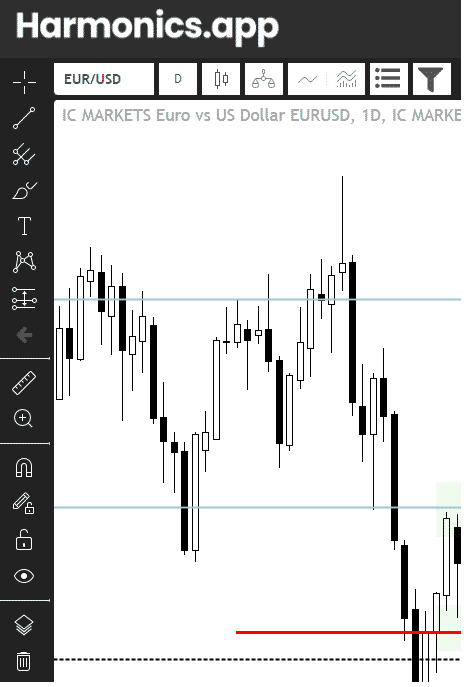
- on the left side you have tools for drawing on the chart
- you can draw horizontal and vertical lines
- write something on the chart
- draw harmonic patterns for yourself
- use pitchfork in trading analysis
- and other tools which you can use if you need them
- on the upper side you have
- currency pair selection
- here you can select which pair you want to analyze
- the easiest way is to start typing and auto suggest mode will offer you pairs with the word you type
- time frame
- select which time frame you will use
- trading harmonic patterns is the best on one hour H1 time frame and higher
- select which time frame you will use
- chart type
- you can select which chart type you want to use
- you can use candlestick chart
- line chart
- bar chart
- area chart
- baseline chart
- hollow candle chart
- you can select which chart type you want to use
- compare symbol
- indicators list
- you can use indicators to help you make the analysis
- templates you can use for the charts
- if you have chart set up with preferred colors you can save template which you can use on other pairs
- hide or show floating pattern list
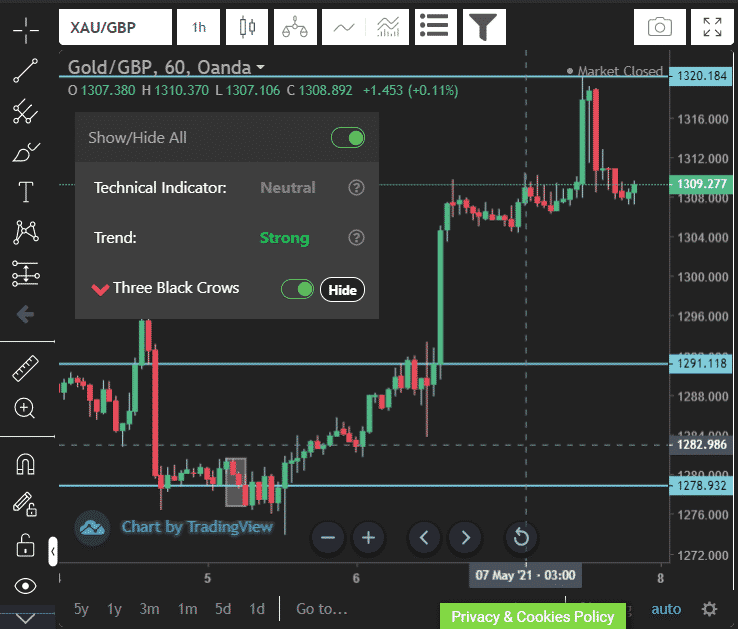
- This is the small window you see on the image. It says “Show/Hide All“
- this window shows you which harmonic patterns are available on the chart
- filter
- this is option to filter out those patterns you do not want to track
- you can select only to follow Gartley pattern and that is all
- currency pair selection

- On the right side you have price bar
- On the upper right side you have additional menu
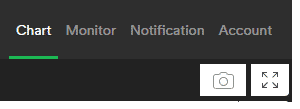
- chart
- this open chart window in front of you
- monitor
- this open new window for you where you can see all patterns available on all pairs on the market
- notification
- here you can see which pairs you have set for notification. When some patterns appears on that pair you will see that pair here and you will be notified
- account
- this is information about you and your account email address
- chart
On the bottom right side you have another menu for settings. There you can change appearance of your chart by changing background color, candlestick colors and other settings
Scanner Chart
Main thing you will do when using a harmonic scanner is to watch the chart in front of you. You will select a currency pair and watch if it has any harmonic pattern available.
Small window “Show/Hide All” shows you which pattern is available on the chart. If there is any you will see the pattern on the list.
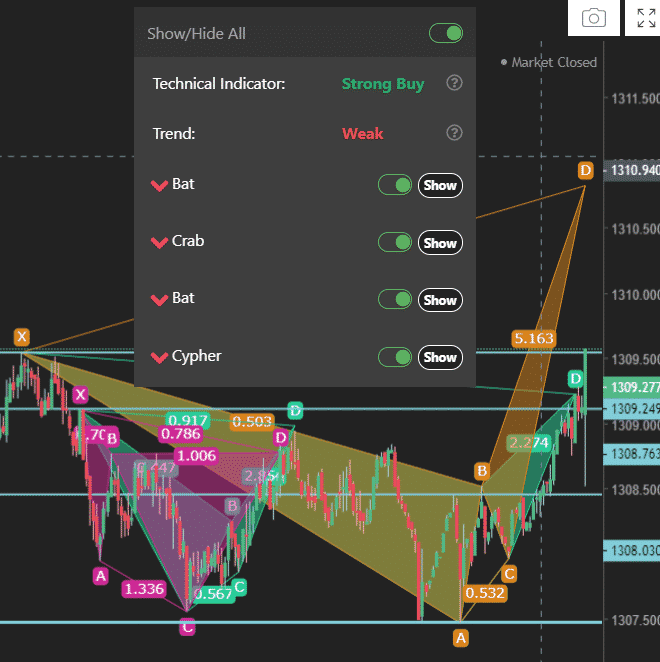
Take a look in the image above. You have a list of patterns the scanner is detected and you can select which one you want to watch.
By clicking on the button on the right side next to the pattern name you will select or deselect the pattern from the chart.
Have in mind that you have two options. First option is using a harmonic scanner to show you only one pattern by selecting the “Show” button. If you press the show button you will have only that pattern on the chart.
If you click on the toggle button left from the “Show” button you will remove that pattern from the chart and all other patterns will stay on the chart visible.
So, these two buttons are for showing and removing certain patterns from the chart. This gives you more options to choose.
This is a good option to have because sometimes you have several patterns at the same time. And if you want to use two patterns to confirm the same trading idea then it is good to remove all other patterns which do not fit into the analysis.
Use Scanner Background Settings
If you want to prepare a chart to the desired background color you can do that by clicking on the bottom right corner where the settings button is.
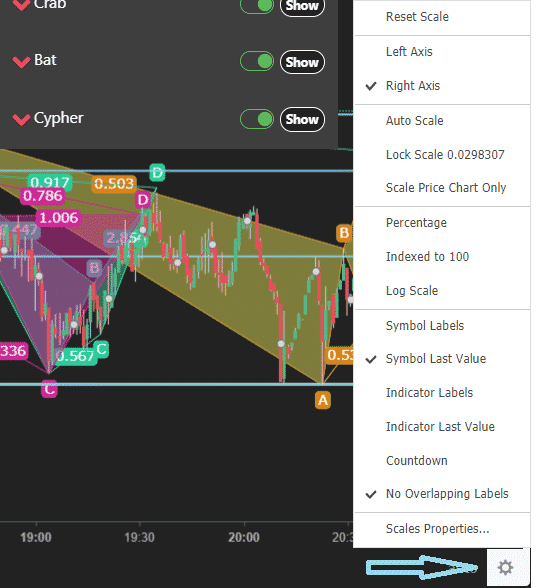
When you click on the settings button you need to select the bottom option “Scales Properties”.
When you click that you will get a new window where more options are available. Select the “background” tab and you will have the option to change the background color.
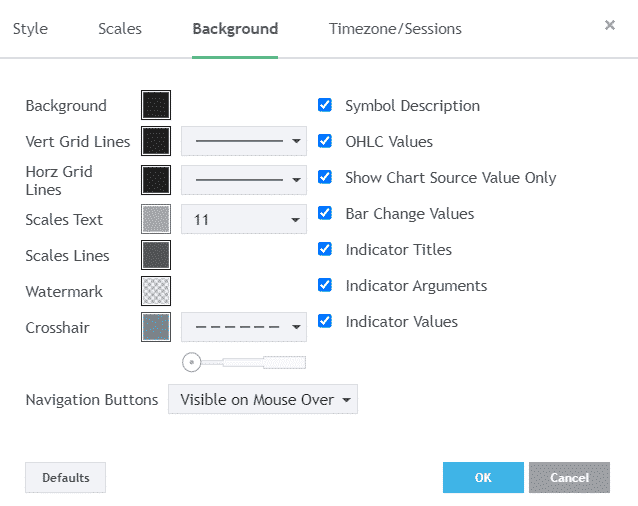
Change Background Color
Now you can change the background color if you want to use a harmonic scanner defined by your preferences.
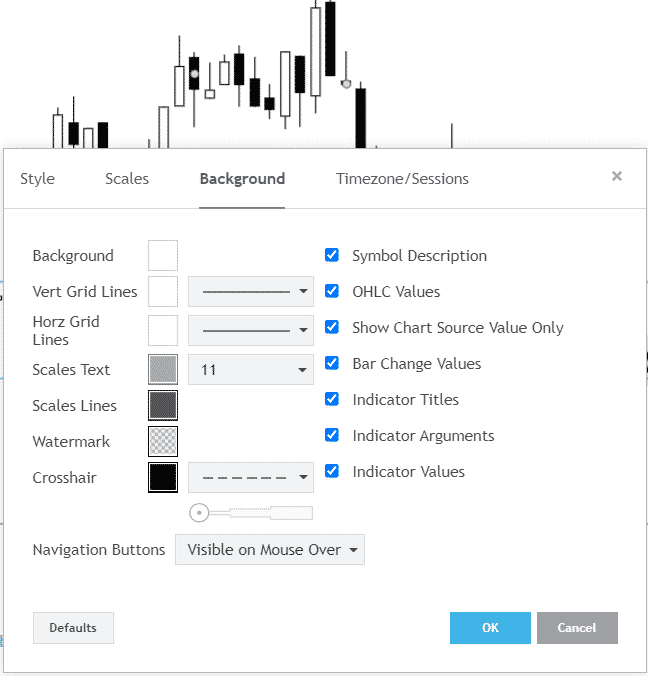
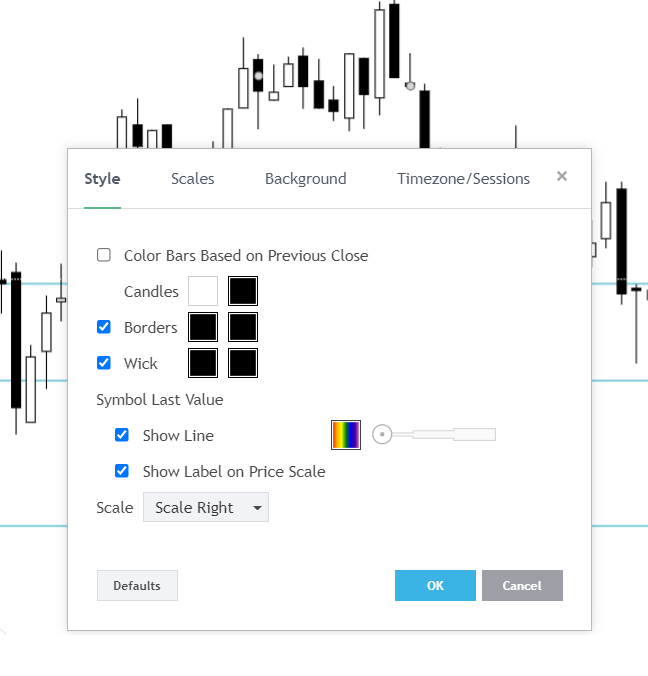
As you can see I have put white and black color settings because I like to have a clean chart in front of me. What you can see is I have set my candlesticks to be white and black so I do not have too many colors on the chart.
If you want to change the colors of the bars take a look at the next image.
Scanner Candlestick Color
To use a harmonic scanner with other candlestick colors you need to switch on “Style” tab and change the colors.
If you want to use the same color settings I have on the chart just change the colors as on the image below.
White color will be for bullish candle and black color will be for bearish candle.
Scanner Drawing Tools
When you have prepared charts for trading you need to prepare yourself for making analysis. Trading analysis is different from trader to trader so I will here explain only the basics you need to do when trading harmonic patterns.
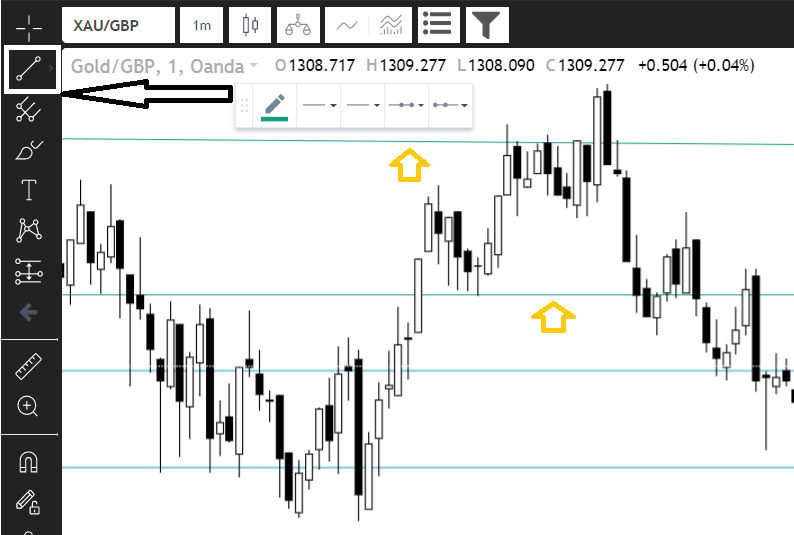
Use harmonic drawing tools like horizontal lines to make support and resistance levels. Those lines can be drawn by using drawing tools on the harmonic scanner which is shown in the image below.
Those lines are shown on the chart as green lines and represent levels where buyers and sellers will make action on the market and the price will react. The price will move up or down depending on its support or resistance.
Conclusion
Using a harmonic scanner is pretty easy and straightforward. You use a scanner to read the chart and to get harmonic patterns detected on the chart so you can enter into the trade or analyze the market.
What I am doing is to draw support and resistance lines to see where they are and where the price can reverse.
That way I increase the probability of harmonic pattern success and profitability.
The best option is to use a harmonic scanner app which will detect patterns for you so you do not need to waste time and energy.
You only need to make the trading analysis and select which pattern to trade.
Harmonic Patterns Cheat Sheet
All Harmonic Patterns on one place with important tips for trading.

0 Comments