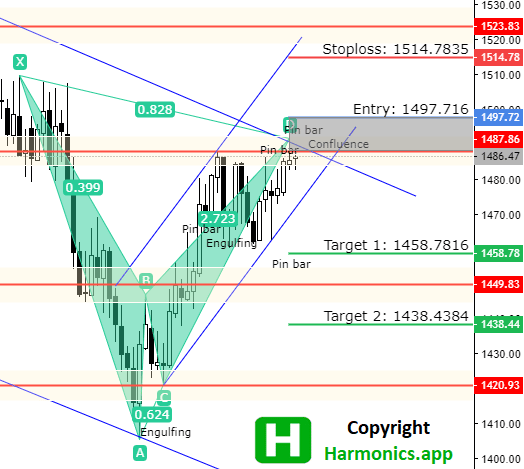
XAU/GBP – Bat Pattern
The XAU/GBP currency pair is currently in the small uptrend, but in the large downtrend channel.
The price reached a downtrend channel resistance line where it is crossing with horizontal resistance. This crossing confluence areas of resistance for the price.
The price formed a bearish Pin bar at that confluence which gives additional signal for a bearish move.
Looking past price reaction at this level we can see several bounces from this level so we have a strong resistance in front. but the price is attempting to break this resistance for a while. So, the resistance could easily be broken.

Facebook Community
Do not forget to join facebook community where you can see trading ideas, strategies and share your own trading ideas and strategy
We have a bearish Bat pattern suggesting move down with the first target at 1458.78 level. Potential reversal zone is at the current price level so the entry could be right now.
Entry level is expanding up to 1497.71 so we have a potential better entry.
If we check the technical analysis we can see a bearish Pin bar at the confluence of resistance. With downtrend channel resistance and horizontal resistance level there is a high chance of seeing this pair at lower levels.
What must be taken in consideration is that the price is attempting to break above 1487.86 level for several times. So we could see a breakout.
But, if the breakout happens we should look for a false breakout which could be a great opportunity to enter into a bearish bat pattern.
Stop loss is close to the next resistance level at 1514.78. This is the level where the price will reach if the bearish scenario is completely cancelled.
We have 1510.00 level which is the first level which will represent bearish Bat pattern is not valid anymore. So, to lower the risk the stop loss can be moved to 1510.00.
First profit target at 1458.78 is highly likely if the price break breaks outside the uptrend channel support line. First profit target is above the first support level at 1449.83, where the price has reached each time when it was moving down.
So, if the price starts to move down, the first profit target is highly likely.
Second profit target is less likely because the price would need to break strong support at 1449.83. This support level has held the price several times in the past so it will be hard to break below.
If the price reaches the first profit target it would be good to lower the risk and put the stop loss below the entry point just to be in profit if the price reverses.
Check other trading analysis inside – Bat Pattern Trading articles
Price Action Analysis
With this PDF you will have step by step guide how to analyse harmonic patterns detected by the Harmonics.app scanner
MEMBER AREA – UPDATE
Below is an update on the trading analysis where you can see more details how the trade is doing.
You will see the trade inside MT4 on a trading account so you can use the same Risk:Reward ratio to calculate the risk and set proper profit percentage.
Join the members and learn more how to make the analysis.
Video
….

0 Comments