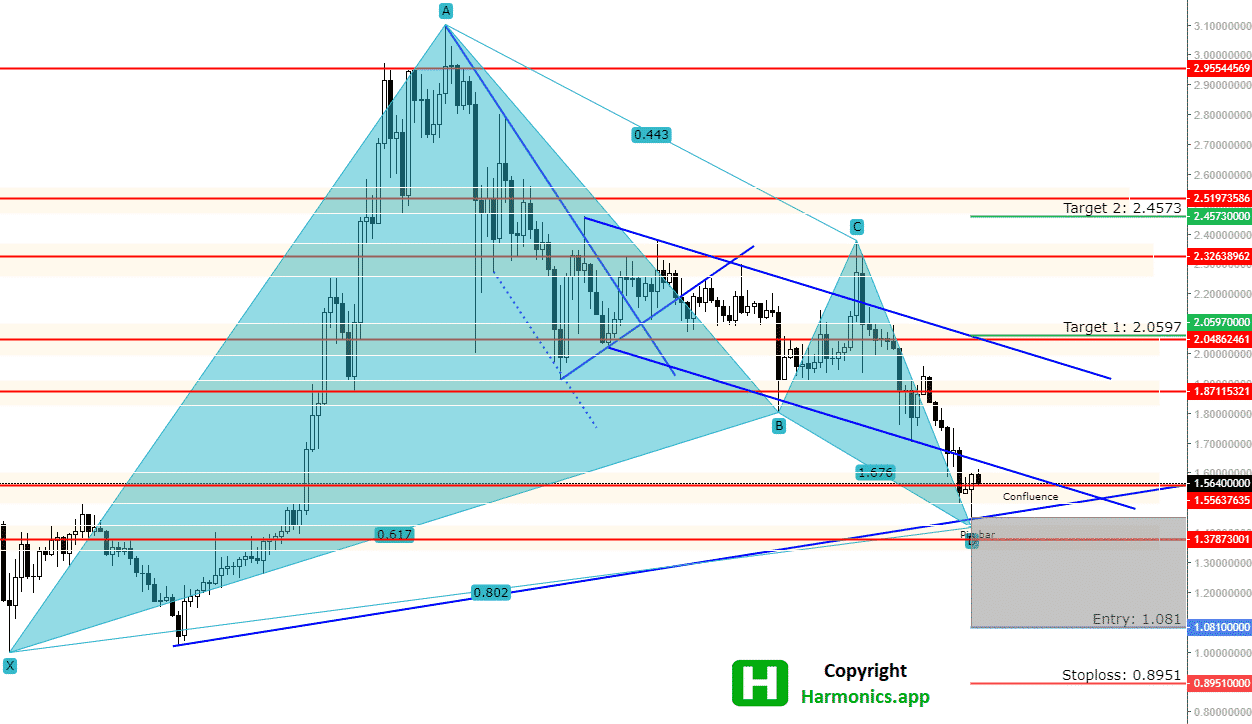
ADA/USDT Forecast
ADA/USD has been in bearish mode for the last two and half weeks when it was at the 2,32638 level.
The price has found strong resistance at that level and could not break above since it had dropped below in September.
Now we have a bullish Gartley harmonic pattern formed on the chart which points the price could move to 2.05970 level.
That is the first target for the price. It is also a level on the first resistance which is a confluence of resistance.
Confluence consists of downtrend channel and horizontal resistance. But, looking into the past you can see that this resistance was not strong for the bullish move.

Facebook Community
Do not forget to join facebook community where you can see trading ideas, strategies and share your own trading ideas and strategy
The second profit target at 2.45730 is above strong resistance where the price will have a hard time to reach.
If the break above this strong resistance happens then the price will be in the bullish sentiment.
Entry point for the price is below current price at 1.08100 which is right on the support level that held the price in the past from falling down.
It is a strong support that will be hard to break below.
Stop loss is at 0.89510 which is below lows since February this year. And since then the price did not reach levels below. So, the stop loss level is less likely to be reached.
What we can see now is that the price has reached an uptrend line which could make it hard to reach lower levels where the entry level is.
So, the potential reversal zone shows the entry level can be anywhere from the current level which is 1.56400.
Risk to rewards is 5,1 which presents great trading opportunity.
Check other trading analysis inside – Gartley Pattern Trading articles
Price Action Analysis
With this PDF you will have step by step guide how to analyse harmonic patterns detected by the Harmonics.app scanner
Price Action Analysis Details – For GOLD members
Join and read below all details about analysis on thih pair.

0 Comments