Price Trap, A Simple Strategy For New IM Harmonics Traders
Using the IM Harmonics Scanner combined with the Price Trap strategy can help you find high possibility trades within the forex market.
What tools you will need to execute Price Trap
In order to effectively execute the price trap strategy, you will need a good knowledge of the forex market. By signing up to a forex basics course you can learn the basic fundamentals of the forex markets.
Once you have this knowledge a harmonics pattern scanner like Harmonics.app or Harmonics.im will give you an edge and find ideal setups on a weekly basis.
Finally, you will need a TradingView Pro account which will allow you to set alerts on securities you are watching.

Selecting the correct timeframe
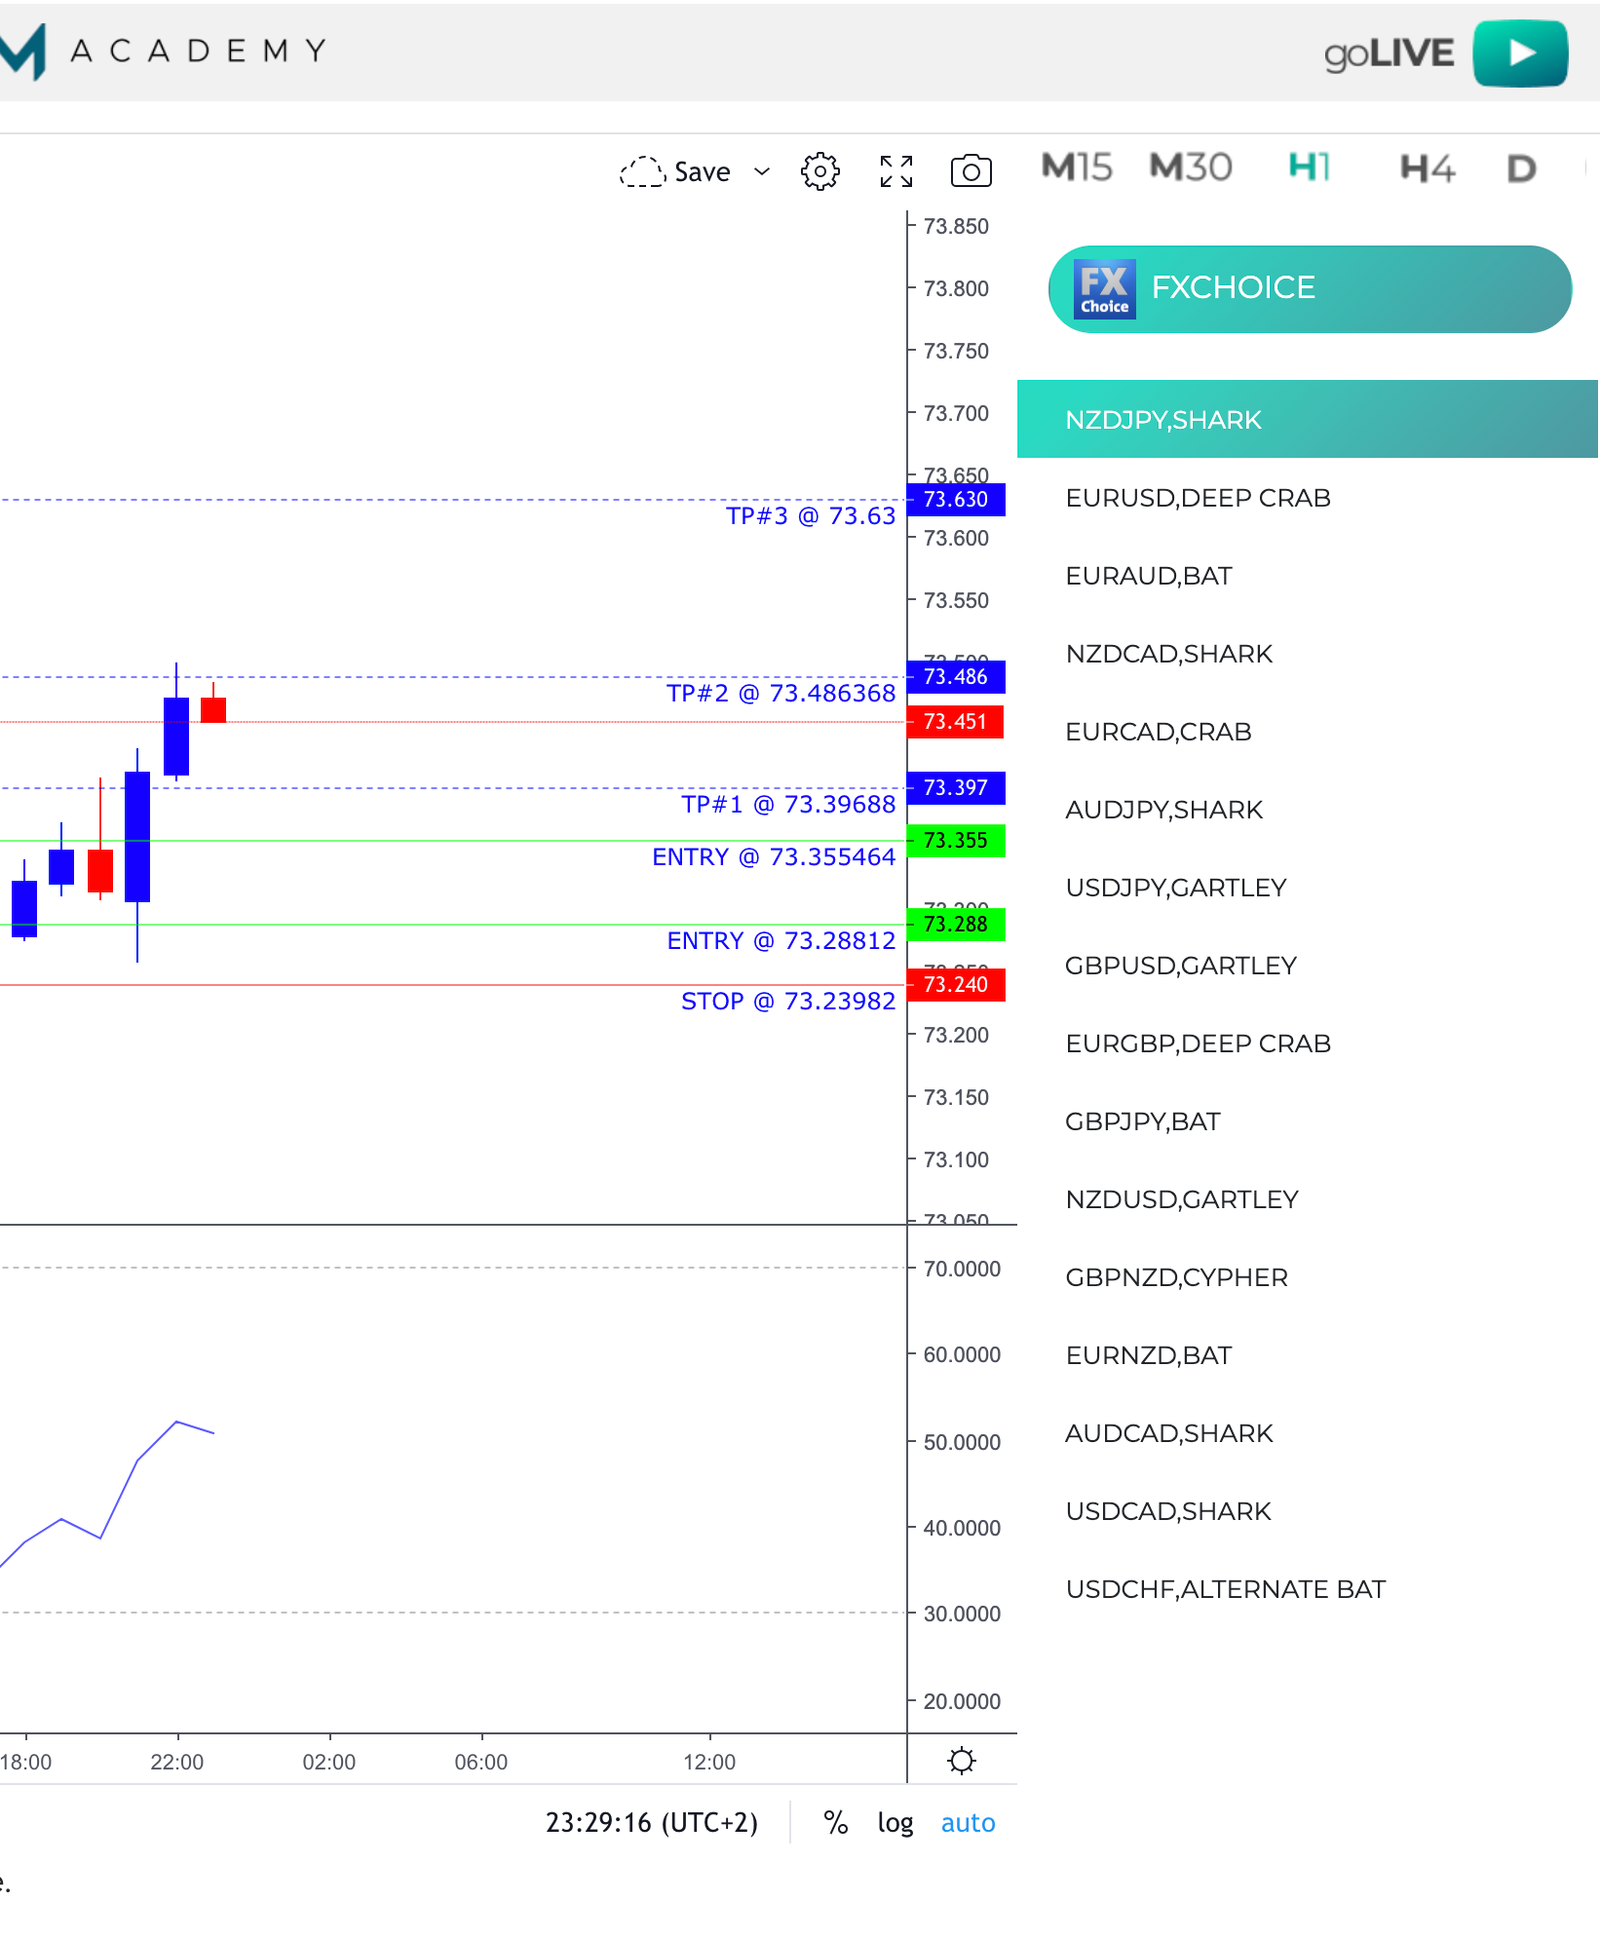
The way I find my setups are using the 1 HOUR timeframes. This can be set using the panel on the right of your screen within the harmonics scanner.
1 Hour Timeframe
Using the 1-hour timeframe allows you time to set your trades up. Remember, be patient with your trades.
Setup Scanner
By utilising the scanners advanced notifications, you can be alerted of patterns 24 hours a day 5 days a week.

Begin by finding the ideal Harmonic Pattern
Harmonics.im may provide you with a many Harmonic Patterns during the week but identifying and cherry-picking the patterns is key with using price trap.
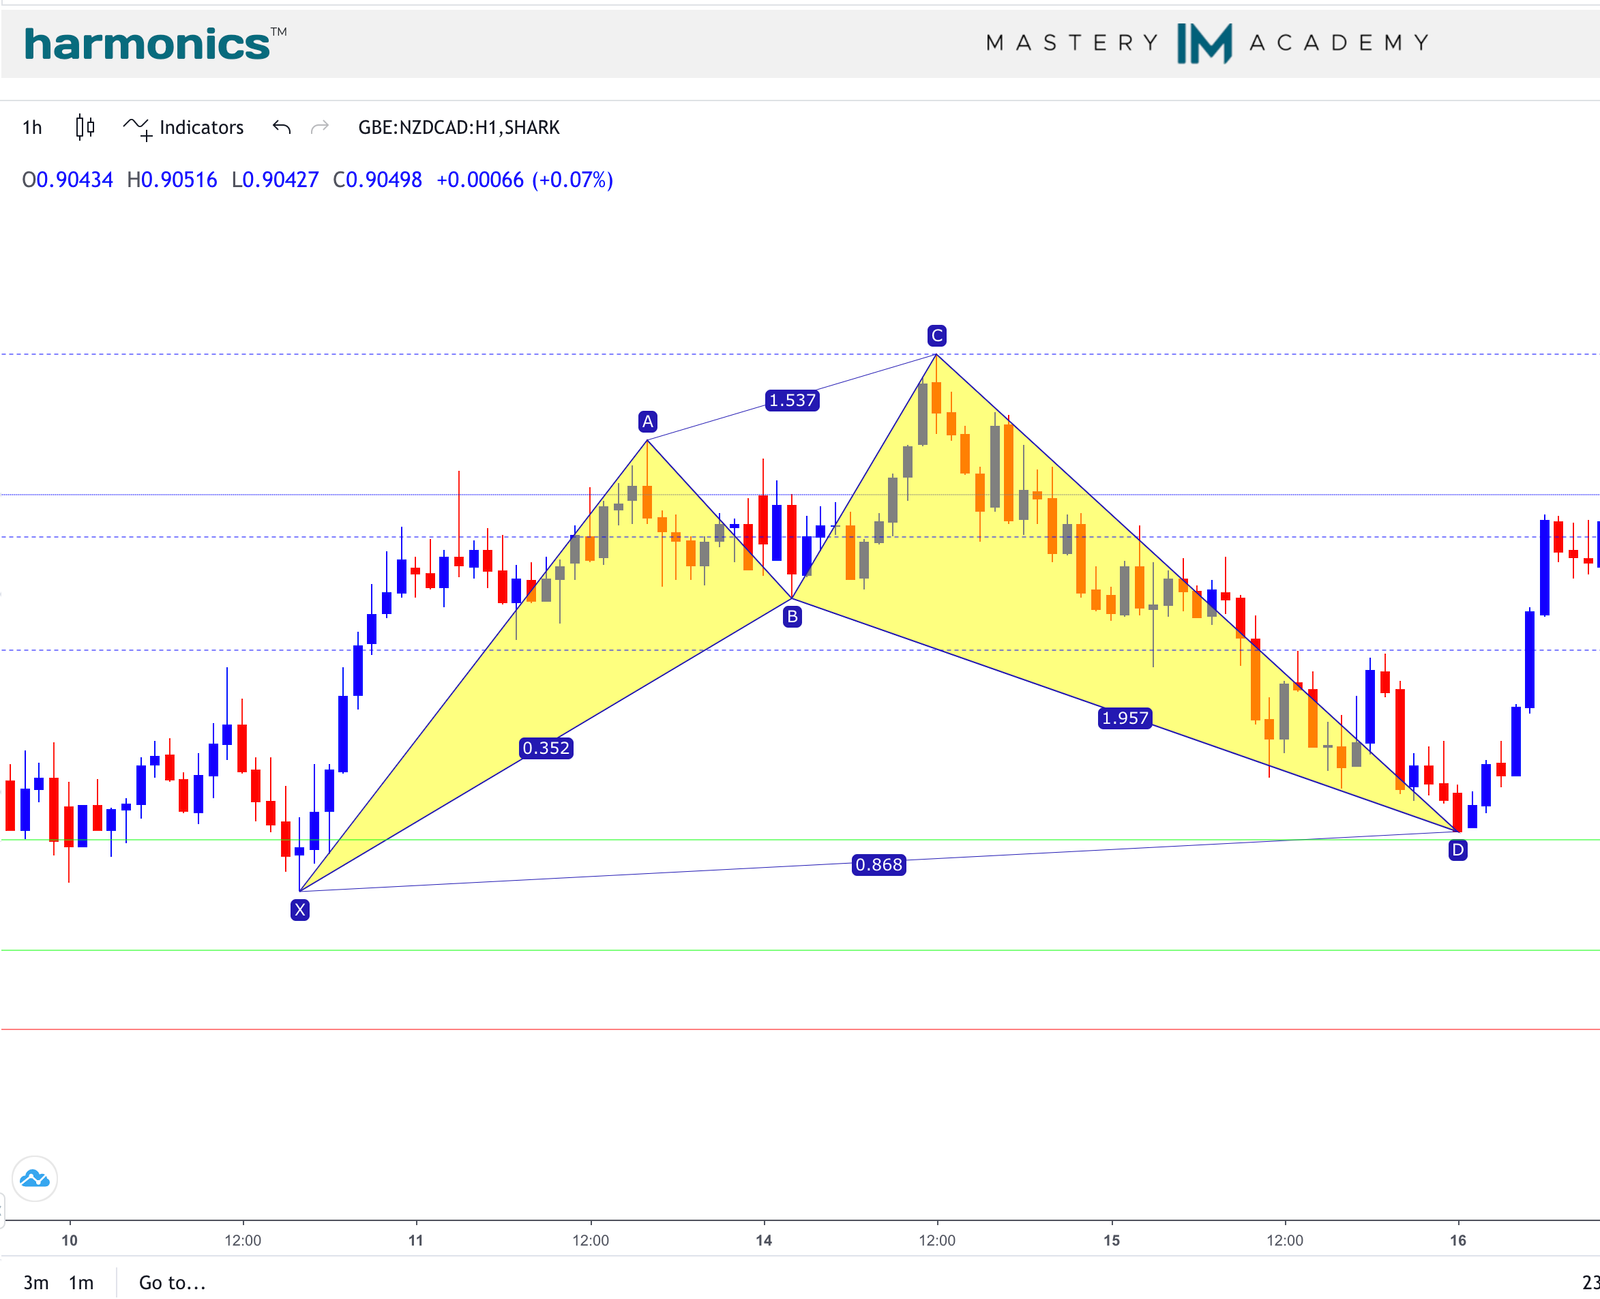
Find large patterns within the IM Harmonics scanner, as these will provide much larger moves ensuring you secure a fair trade.
The ideal harmonic pattern should have 60+ bars within the entire pattern.
Large Harmonic Pattern
Using the price trap strategy with larger harmonic patterns is key, the move will be much larger ensuring you catch the right amount of pips within the market.
Has The Trade Already Happened?
You must ensure the trade has not already made its move to the TP or SL within the chart view on Harmonics.im

Price Trap using TradingView
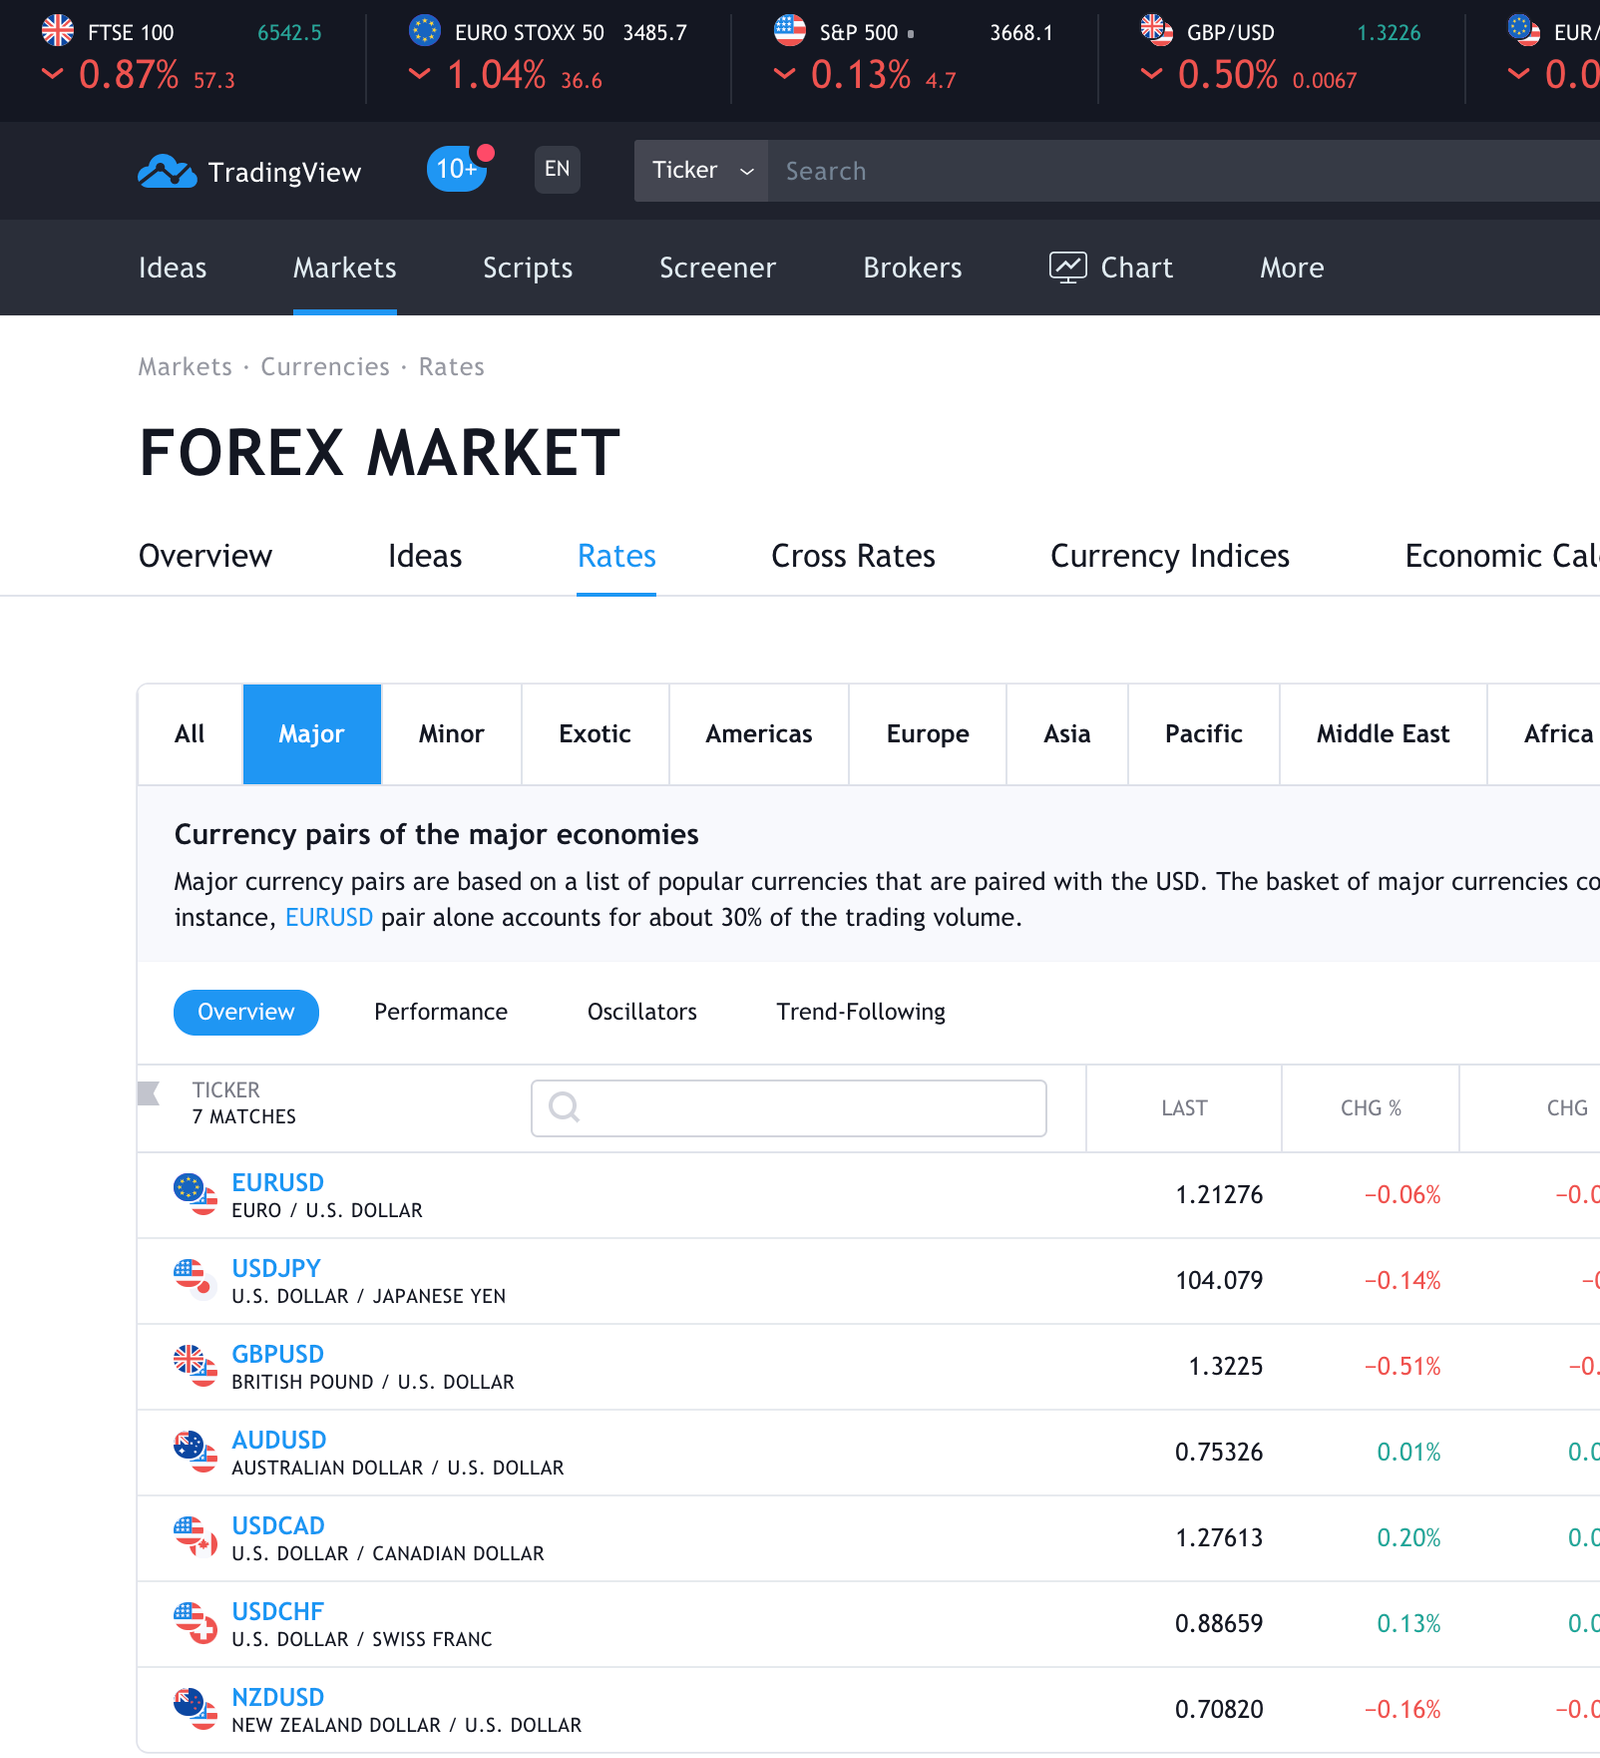
Once you have found the security on IM Harmonics Scanner, type the currency pair into your TradingView account watchlist.
Once the pair has been added to the watchlist, open the chart and ZOOM OUT.
Zooming out on the charts allows you to spot prime areas of SUPPORT and RESISTANCE making it easier to find your zones to trap above and below, where the price is currently.
Think of the charts like a spy hole in the door, you can see more if you open the door. Zoom out, it will help you identify the key areas much faster and more confidently.
Finding zones confidently within the currency pair
Finding the zones can be difficult for many people, you find yourself questioning the locations, the thickness, the range and everything in between. Being uncertain about your zones can create problems in the future of the trade.
To find a top and bottom zone confidently, you need to start with zooming out on the charts.
Once you have zoomed out and place one horizontal line at the most recent high. Then a single line at the most recent low.
Previous Touches
Ensure the lines you have drawn have a good amount of touches along that line. Three or more is one of my rules. It’s up to you to define this value in your own trading plan.
No Touches?
None or not enough touches? The zones you have selected should not be used. Try zooming out more, if this does not solve the problem, do not trade that currency pair today.
Improving your zones
Currently, the zones you have are just single lines which could lead you into a trade too soon within poor confirmations.
Think of the lines as two sheets of Ice, too thin and it could break easily or too thick and it will take more to break.
To define the thickness I tend to have these ‘zones’ around 5pips.
Use previous bodies and wicks of candles to establish the zones.
Use previous candles
Use the bodies and wicks of the previous candles around the zones to define the thickness.
Think about ICE
Make sure the zones are not too thick. Keep the zones between 4 – 7 pips.
Set alerts to be notified of breaks & retests
By setting alerts on the charts, this will allow you to carry on with your day. You will be sent a notification by TradingView to your mobile device when the alert is triggered.
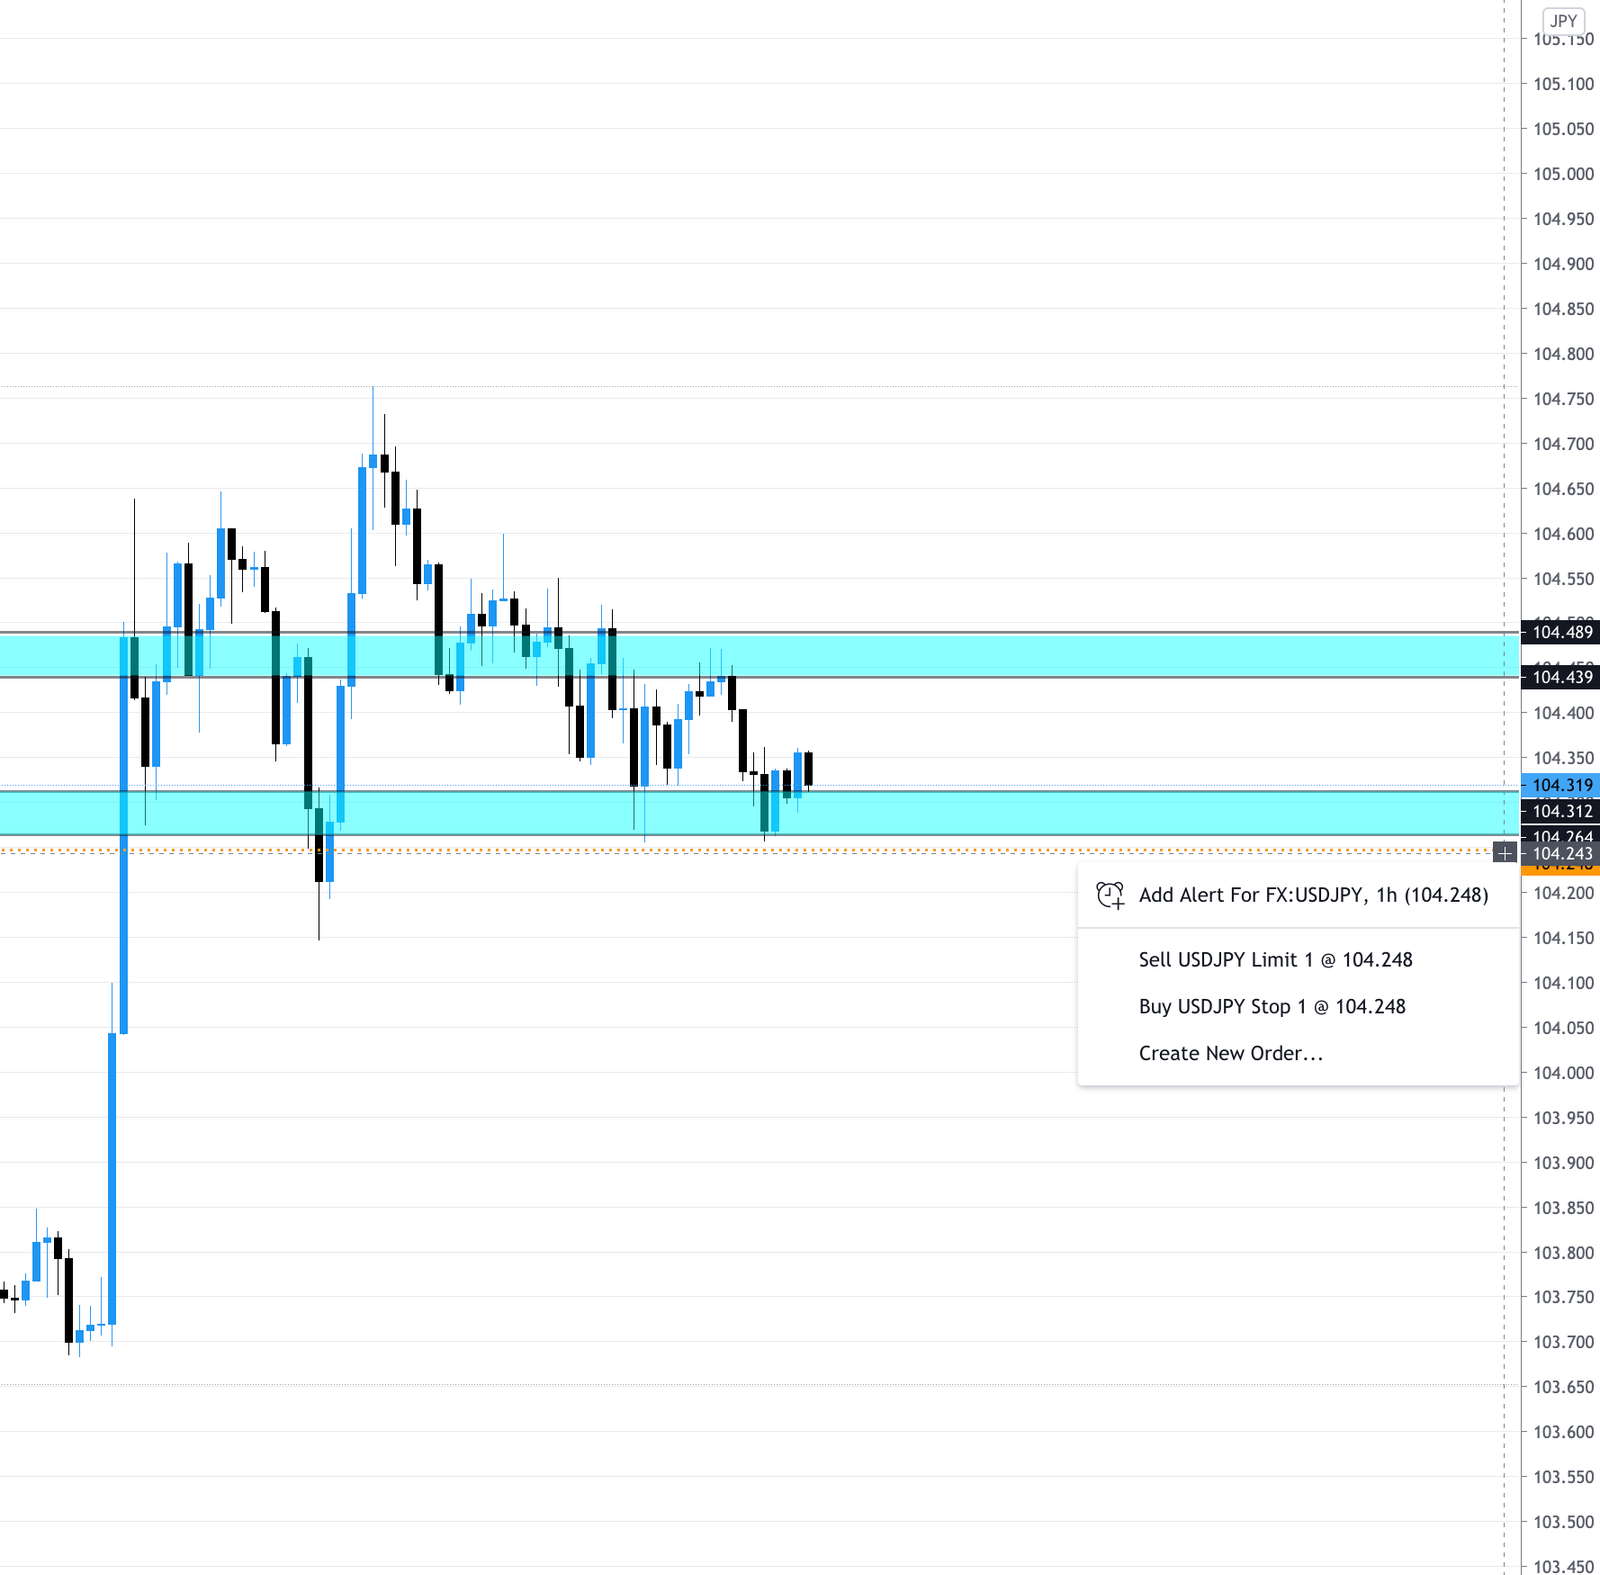
Set your alert 1 pip above the top zone and 1 pip below the bottom zone.
You are waiting for a clear break of the top or bottom zone to start with. Once this alert has been triggered, you can go ahead and set an alert for the retest. Set the alert in the same locations as the break alert.
To add an alert, hover your cursor just left of the price bar and click the ‘+’ icon. Then click ‘Add Alert For ……’
This is only available to pro members of TradingView, register here: Sign Up to TradingView Pro

When price breaks a zone
In the example shown, the price has broken the bottom zone. Wait for the candle to fully complete and close below the zone.
This is not your entry to the trade. This could be a stop hunt by the institutions to take the market higher.
Waiting for the retest
The retest candle could happen between 1 and 10 hours, so be patient.
Wait for the price to retest the zone. An engulfing candle can indicate a new high/low.
Once the engulfment candle has formed and completed, it is safe to enter the trade.
Always use good risk management when entering any trade.
Allow your trade to run it’s course
Using this method, some trades may take 24 hours to complete, this is not a problem. Just ensure you hold your nerve and remain confident with your entry to the market.
Taking partials throughout the trade is recommended, we will have a post for this in the near future.
Ensure you build a trading plan that helps you through the process. Professional traders set specific rules to ensure they only trade when a trade is available.
To recap on the Price Trap strategy with IM Harmonics Scanner
This strategy requires a lot of patience, I urge you to backtest and LIVE TEST this strategy for at least 1 month before implementing into a real trading account.
Please be aware, some days you may not find any trade setups.
This is not financial advice and is strictly for educational purposes only.

0 Comments