NZD/USD Forecast
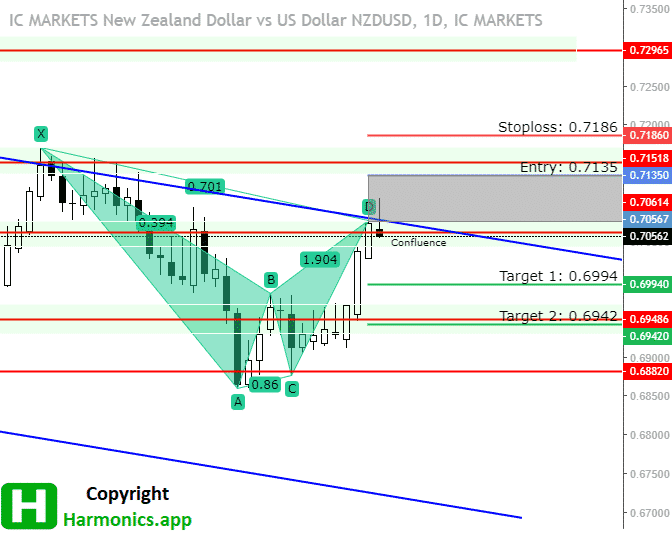
The week before closed strong in the bullish mode where the last three days were strongly bullish and the price moved 100 pips from the strong support zone at 0.69486.
We have the NZD/USD pair at 0.70500 which is right on the confluence of resistance where the downtrend channel resistance line is crossing the horizontal resistance line.
This resistance level acted as a strong resistance level in the middle of September.
Earlier the price touched several times the resistance in June, July and August. So, this resistance level will have significant impact on the current price.

Adding Bat harmonic pattern that are formed on the current price gives more indication the price will find its way down from the current price.
The pair needs to break above 0.71518 and close on a daily time frame to change the market overview into bullish mode.
The price will have a hard time to break above, but here is a potential bearish entry zone with a profit target around 0.69420 which is the support zone
and the first obstacle for the price to break below.
Stop loss should be placed above 0.71860.
Until the price is above 0.69420 I am not changing the bias completely into bearish because strong bullish candles show bearish weakness.
Only a break below 0.69420 on a daily basis will change the bias into bearish.
Check other trading analysis inside – Bat Pattern Trading articles
Harmonic Patterns Cheat Sheet
All Harmonic Patterns on one place with important tips for trading.


0 Comments