
The Shark pattern is an exhaustion pattern with five points and with four legs defined by Scott Carney who also defined Fibonnaci ratio patterns like Bat, Crab, Gartley and 5-0 pattern.
感谢您阅读本文,别忘了订阅!Shart pattern is a pattern which uses 0, X, A, B, and C points where the D point is not used like other harmonic patterns do.


Harmonic Bat Pattern Analysis 13.12.2025
别忘了加入Facebook社区,在那里您可以查看交易想法、策略并分享...
Harmonic Bat Pattern Analysis 6.12.2025
别忘了加入Facebook社区,在那里您可以查看交易想法、策略并分享...
Harmonic Bat Pattern Analysis 29.11.2025
别忘了加入Facebook社区,在那里您可以查看交易想法、策略并分享...
Shark Pattern In Forex
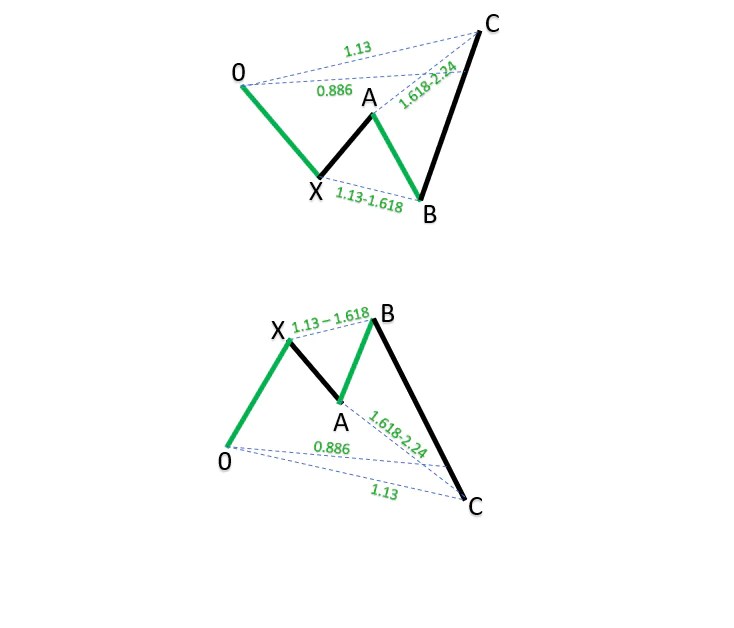
The Shark pattern in Forex is defined with the first O-X leg which is formed by the swing move. After the O-X leg we have X-A leg which is retracement of 0-X leg.
That retracement X-A leg does not have clearly defined retracement level, but it is mandatory it does not go beyond O point.
Then, A-B leg is the third leg with 1.13 – 1.61 of X-A leg. The B point is above X point in case of bullish Shark pattern and it is below X point in case of bearish Shark pattern.
Then we have B-C leg where the C point goes close to 0 point or it goes beyond 0 point.
When the price reaches the C point we can expect the price to move in the 0-X direction.
Bullish Shark Pattern In Forex
In the bullish Shark pattern you enter into the trade at the C point where you look for D point as an exit level.
Bullish Shark pattern in Forex is used to find a reversal level for the currency pair price where you can have tight stop loss just below C point.
What you can see on the image below is that the Shark pattern in the bullish scenario has a C point below starting 0 point.
The D point which is not visible on the image is 50% retracement of B-C leg.
What is different compared to other harmonic patterns is that you do not have retracement Fibonnaci ratio for A point.

Bearish Shark Pattern In Forex
The Bearish Shark pattern is on the image below where you can see C point on the top of the pattern and it is a point where you can enter with sell order.
Stop loss should be placed above C point and D point which is 50% retracement of B-C leg is first target point.
What is good to remember is that in case of bearish or bullish Shark patterns you will have quick reaction on the C point so be careful when using tight Stop Loss to avoid sudden market spikes which could kick you out of the market.

How Do You Trade Shark Patterns?
Shark pattern is traded by entering into the trade on the C point and using D point as a profit target point.
D point is defined as a 50% retracement of B-C leg. Second profit target is 100% retracement of B-C leg.
Here is an example of how to trade Shark patterns.
Image is used from the paid Harmonic scanner which you can access here.
trade shark pattern
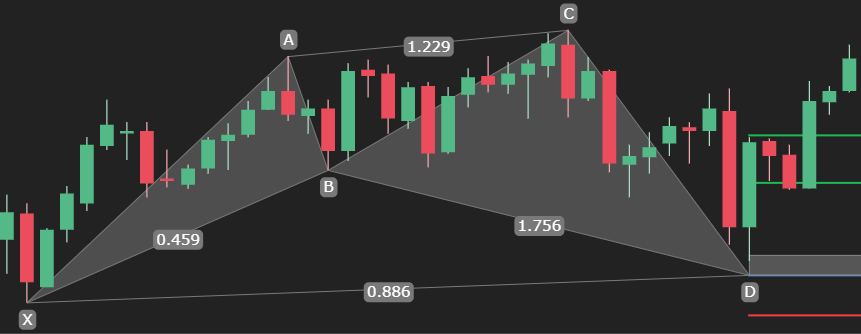
This bullish Shark pattern was successful where you can see the price has returned from the D point back to C point.
Note: In this example I am using X, A, B, C, D points instead 0, X, A, B, C points.
The entry point into the trade was at the D point. It was a potential reversal zone, PRZ, where the stop loss was set below the D point.
First target was at the 50% retracement and the price reached that in one day. The chart shows the daily time frame so each candle represents one day.
Second target, and that is 100% retrace from the D point took several days. But, it was worth waiting because the move was 300 pips strong.
Shark Pattern Trading Example
Below is an image of real trading example where scanner has shown completed Shark pattern with potential reversal zone and with trading levels.
Scanner shows where to enter, where to set stop loss and where to exit with profits.
Your job is to decide will you use only these levels or you will confirm them with another analysis, like price action.
What you can see the market has moved in the right direction and reached first profit target.
It is also moving to the second profit target which will give more than 100 pips just on this trade.
If you want to get notification when the pattern is complete you can use scanner to send you message so you can enter into the trade.
结论
The Shark pattern is one of the most profitable harmonic trading patterns.
It is a reversal pattern with C point or D point as entry point depending which labeling convention you use.
To draw the Shark pattern you should pay attention to draw D point below X point.
If you want to use a harmonic scanner which will draw a Shark pattern automatically for you and send you notification then check the scanner on the link below.
谐波形态速查表
所有谐波形态集中一处,包含重要的交易技巧。
0条评论